Radio Shack 2003 Annual Report Download - page 41
Download and view the complete annual report
Please find page 41 of the 2003 Radio Shack annual report below. You can navigate through the pages in the report by either clicking on the pages listed below, or by using the keyword search tool below to find specific information within the annual report.-
 1
1 -
2
-
3
-
4
-
5
-
6
-
7
-
8
-
9
-
10
-
11
-
12
-
13
-
14
-
15
-
16
-
17
-
18
-
19
-
20
-
21
-
22
-
23
-
24
-
25
-
26
-
27
-
28
-
29
-
30
-
 31
31 -
 32
32 -
 33
33 -
 34
34 -
 35
35 -
 36
36 -
 37
37 -
 38
38 -
 39
39 -
 40
40 -
 41
41 -
 42
42 -
 43
43 -
 44
44 -
 45
45 -
 46
46 -
 47
47 -
 48
48 -
 49
49 -
 50
50 -
 51
51 -
52
-
53
-
54
-
55
-
56
-
57
-
58
-
59
-
60
 |
 |

RADIOSHACK 2003 Annual Report 39
services pursuant to the contracts exceeds the related
unearned revenue.
Vendor Allowances: We receive allowances from third-party
service providers and product vendors through a variety
of promotional programs and arrangements as a result of
purchasing and promoting their products and services in the
normal course of business.We consider vendor allowances
received to be a reduction in the price of a vendor’s products
or services and record them as a component of cost of
products sold when the related product or service is sold,
unless the allowances represent reimbursement of specific,
incremental and identifiable costs incurred to promote a
vendor’s products and services, in which case we record them
when earned as an offset to the associated expense
incurred to promote the applicable products and/or services.
Advertising Costs: Our advertising costs are expensed the
first time the advertising takes place.We receive allowances
from certain third-party service providers and product ven-
dors which we record when earned as an offset to
advertising expense incurred to promote the applicable
products and/or services only if the allowances represent
reimbursement of specific, incremental and identifiable
costs (see “Vendor Allowances”above). Advertising expense
was $254.4 million, $241.0 million and $253.9 million for
the years ended December 31, 2003, 2002 and 2001 respec-
tively, net of vendor allowances of $40.9 million, $59.6
million and $53.1 million, respectively.
Stock-Based Compensation: At December 31, 2003, we had
stock-based employee compensation plans.We measure
stock-based compensation costs under Accounting
Principles Board (“APB”) Opinion No. 25,“Accounting for
Stock Issued to Employees”and its related interpretations.
Accordingly, no compensation expense has been recog-
nized for our fixed price stock option plans, as the exercise
price of options must be equal to or greater than the stock
price on the date of grant under our incentive stock plans.
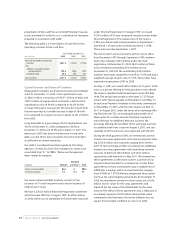
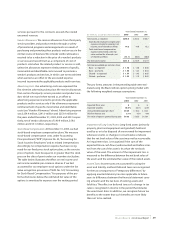
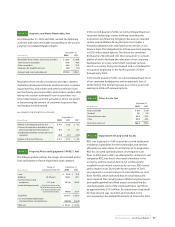
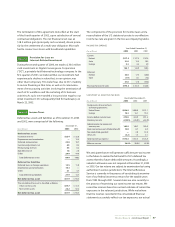
The table below illustrates the effect on net income and
net income available per common share as if we had
accounted for our employee stock options under the fair
value recognition provisions of SFAS No. 123,“Accounting
for Stock-Based Compensation.” For purposes of the pro
forma disclosures below, the estimated fair value of the
options is amortized to expense over the vesting period.
Year Ended December 31,
(In millions, except per share amounts) 2003 2002 2001
Net income, as reported $298.5 $263.4 $166.7
Stock-based employee compensation
expense included in reported net
income, net of related tax effects 14.2 14.0 15.2
Total stock-based compensation
expense determined under fair
value method for all awards, net
of related tax effects (51.1) (60.5) (60.0)
Pro forma net income $261.6 $216.9 $121.9
Net income available per common share:
Basic – as reported $ 1.78 $ 1.50 $ 0.88
Basic – pro forma $ 1.56 $ 1.23 $ 0.64
Diluted – as reported $ 1.77 $ 1.45 $ 0.85
Diluted – pro forma $ 1.55 $ 1.19 $ 0.62
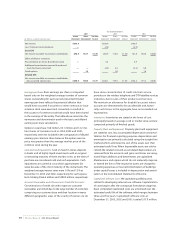
The pro forma amounts in the preceding table were esti-
mated using the Black-Scholes option-pricing model with
the following weighted average assumptions:
Year Ended December 31,
2003 2002 2001
Expected life in years 666
Expected volatility 48.3% 46.1% 42.3%
Annual dividend paid per share $ 0.25 $ 0.22 $ 0.22
Risk free interest rate 3.1% 4.5% 4.9%
Fair value of options granted during year $ 9.63 $13.53 $15.64
Impairment of Long-Lived Assets: Long-lived assets (primarily
property, plant and equipment and goodwill) held and
used by us or to be disposed of are reviewed for impairment
whenever events or changes in circumstances indicate
that the net book value of the asset may not be recoverable.
An impairment loss is recognized if the sum of the
expected future cash flows (undiscounted and before inter-
est) from the use of the asset is less than the net book
value of the asset.The amount of the impairment loss is
measured as the difference between the net book value of
the assets and the estimated fair value of the related assets.
Income Taxes: Income taxes are accounted for using the
asset and liability method. Deferred taxes are recognized
for the tax consequences of “temporary differences”by
applying enacted statutory tax rates applicable to future
years to differences between the financial statement carry-
ing amounts and the tax basis of existing assets and
liabilities.The effect on deferred taxes of a change in tax
rates is recognized in income in the period that includes
the enactment date. In addition, we recognize future tax
benefits to the extent that such benefits are more likely
than not to be realized.