Radio Shack 2003 Annual Report Download - page 36
Download and view the complete annual report
Please find page 36 of the 2003 Radio Shack annual report below. You can navigate through the pages in the report by either clicking on the pages listed below, or by using the keyword search tool below to find specific information within the annual report.-
 1
1 -
2
-
3
-
4
-
5
-
6
-
7
-
8
-
9
-
10
-
11
-
12
-
13
-
14
-
15
-
16
-
17
-
18
-
19
-
20
-
21
-
22
-
23
-
24
-
25
-
 26
26 -
 27
27 -
 28
28 -
 29
29 -
 30
30 -
 31
31 -
 32
32 -
 33
33 -
 34
34 -
 35
35 -
 36
36 -
 37
37 -
 38
38 -
 39
39 -
 40
40 -
 41
41 -
 42
42 -
 43
43 -
 44
44 -
 45
45 -
 46
46 -
47
-
48
-
49
-
50
-
51
-
52
-
53
-
54
-
55
-
56
-
57
-
58
-
59
-
60
 |
 |

RADIOSHACK 2003 Annual Report
34
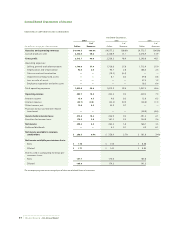
Consolidated Statements of Income
RADIOSHACK CORPORATION AND SUBSIDIARIES
Year Ended December 31,
2003
2002 2001
% of
% of % of
(In millions, except per share amounts) Dollars Revenues
Dollars Revenues Dollars Revenues
Net sales and operating revenues $4,649.3 100.0% $4,577.2 100.0% $4,775.7 100.0%
Cost of products sold 2,333.6 50.2 2,338.9 51.1 2,478.9 51.9
Gross profit 2,315.7 49.8 2,238.3 48.9 2,296.8 48.1
Operating expenses:
Selling, general and administrative 1,740.0 37.4 1,728.6 37.8 1,713.9 35.9
Depreciation and amortization 92.0 2.0 94.7 2.0 108.3 2.3
Gain on contract termination —— (18.5) (0.4) — —
Impairment of long-lived assets —— 8.1 0.2 39.8 0.8
Loss on sale of assets —— — — 57.2 1.2
Employee separation and other costs —— — — 18.3 0.4
Total operating expenses 1,832.0 39.4 1,812.9 39.6 1,937.5 40.6
Operating income 483.7 10.4 425.4 9.3 359.3 7.5
Interest income 12.8 0.3 9.0 0.2 13.0 0.3
Interest expense (35.7) (0.8) (43.4) (0.9) (50.8) (1.1)
Other income, net 12.0 0.3 33.9 0.7 — —
Provision for loss on Internet-related
investment —— — — (30.0) (0.6)
Income before income taxes 472.8 10.2 424.9 9.3 291.5 6.1
Provision for income taxes 174.3 3.8 161.5 3.5 124.8 2.6
Net income 298.5 6.4 263.4 5.8 166.7 3.5
Preferred dividends —— 4.5 0.1 4.9 0.1
Net income available to common
stockholders $ 298.5 6.4% $ 258.9 5.7% $ 161.8 3.4%
Net income available per common share:
Basic $ 1.78 $ 1.50 $ 0.88
Diluted $ 1.77 $ 1.45 $ 0.85
Shares used in computing earnings per
common share:
Basic 167.7 173.0 183.8
Diluted 168.9 179.3 191.2
The accompanying notes are an integral part of these consolidated financial statements.