Radio Shack 2003 Annual Report Download - page 45
Download and view the complete annual report
Please find page 45 of the 2003 Radio Shack annual report below. You can navigate through the pages in the report by either clicking on the pages listed below, or by using the keyword search tool below to find specific information within the annual report.-
 1
1 -
2
-
3
-
4
-
5
-
6
-
7
-
8
-
9
-
10
-
11
-
12
-
13
-
14
-
15
-
16
-
17
-
18
-
19
-
20
-
21
-
22
-
23
-
24
-
25
-
26
-
27
-
28
-
29
-
30
-
31
-
32
-
33
-
34
-
 35
35 -
 36
36 -
 37
37 -
 38
38 -
 39
39 -
 40
40 -
 41
41 -
 42
42 -
 43
43 -
 44
44 -
 45
45 -
 46
46 -
 47
47 -
 48
48 -
 49
49 -
 50
50 -
 51
51 -
 52
52 -
 53
53 -
 54
54 -
 55
55 -
56
-
57
-
58
-
59
-
60
 |
 |

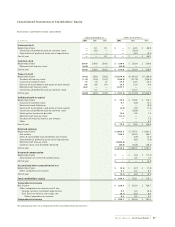
RADIOSHACK 2003 Annual Report 43
In the second quarter of 2002, we sold and leased back our
corporate technology center building, recording this
transaction as a financing obligation, because we retained
certain responsibilities during the lease term. Under a
financing obligation, the associated assets remain on our
balance sheet.This obligation has a three-year term expiring
in 2005 with renewal options.The lessors are unrelated
third-parties. We entered into this transaction in contem-
plation of and to facilitate the relocation of our corporate
headquarters to a new custom-built corporate campus,
which is currently being constructed and is scheduled for
occupation beginning in the fourth quarter of 2004
through early 2005.
In the fourth quarter of 2001, we sold and leased back most
of our corporate headquarters and recognized a loss of
$44.8 million. The operating lease has a three-year term
expiring in 2004 with renewal options.
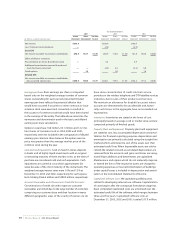
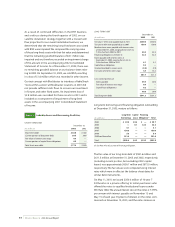
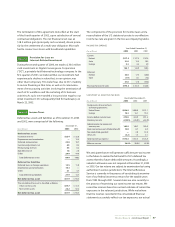
Note 5 Other Assets, Net
December 31,
(In millions) 2003 2002
Notes receivable $ 9.8 $ 4.0
Goodwill 2.9 2.9
Deferred income taxes 22.2 52.2
Other 29.3 40.3
Total other assets,net $64.2 $99.4
Note 6 Impairment of Long-Lived Assets
RSIS was acquired in 1999 to provide us with residential
installation capabilities for the technologies and services
offered in our retail stores. From the time of its acquisition,
RSIS has incurred operating losses and negative cash
flows. In 2000 and in 2001, we attempted to restructure and
reorganize RSIS, but due to the overall slowdown in the
economy and the market decline for professionally
installed home Internet connectivity services, RSIS contin-
ued to report losses. During the fourth quarter of 2001,
we prepared a revised analysis of estimated future cash
flows for RSIS, which indicated that its long-lived assets
were impaired.The carrying value of RSIS’s long-lived assets
(principally goodwill and fixed assets) exceeded the dis-
counted present value of the estimated future cash flows
by approximately $37.0 million. An impairment of goodwill
for that amount was recorded and included in the
accompanying Consolidated Statement of Income for 2001.
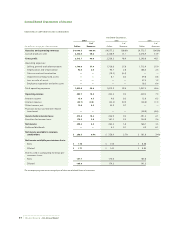
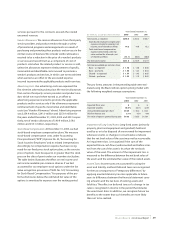
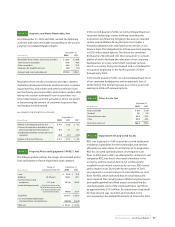
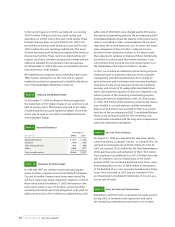
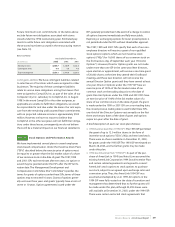
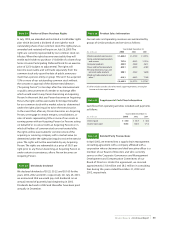
Note 3 Accounts and Notes Receivable, Net
As of December 31, 2003 and 2002, we had the following
accounts and notes receivable outstanding in the accom-
panying Consolidated Balance Sheets:
December 31,
(In millions) 2003 2002
Receivables from vendors and service providers $ 92.3 $120.0
Trade accounts receivable 75.6 70.6
Other receivables 18.6 22.9
Allowance for doubtful accounts (4.1) (7.4)
Accounts and notes receivable, net $182.4 $206.1
Receivables from vendors and service providers relate to
marketing development funds, residual income, customer
acquisition fees, and rebates and other promotions from
our third-party service providers and product vendors, after
taking into account estimates for service providers’ cus-
tomer deactivations and non-activations, which are factors
in determining the amount of customer acquisition fees
and residual income earned.
ALLOWANCE FOR DOUBTFUL ACCOUNTS
December 31,
(In millions) 2003 2002 2001
Balance at the beginning of the year $ 7.4 $ 6.8 $ 6.3
Provision for bad debts included in selling,
general and administrative expense 0.4 4.7 14.5
Uncollected receivables written off, net of
recoveries (3.7) (4.1) (14.0)
Balance at the end of the year $ 4.1 $ 7.4 $ 6.8
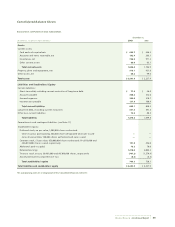
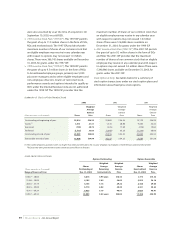
Note 4 Property, Plant and Equipment (“PP&E”), Net
The following table outlines the ranges of estimated useful
lives and balances of each major fixed asset category:
Range of December 31,
(In millions) Estimated Useful Life 2003 2002
Land — $ 35.0 $ 35.0
Buildings 10-40 years 169.1 98.1
Furniture, fixtures and
equipment 2-15 years 631.8 586.9
Leasehold improvements
Primarily, the shorter of the
life of the improvements or the
term of the related lease and
certain renewal periods
345.8 337.4
Total PP&E 1,181.7 1,057.4
Less accumulated depreciation
and amortization of capital leases (668.6) (635.8)
PP&E, net $ 513.1 $ 421.6