Radio Shack 2003 Annual Report Download - page 42
Download and view the complete annual report
Please find page 42 of the 2003 Radio Shack annual report below. You can navigate through the pages in the report by either clicking on the pages listed below, or by using the keyword search tool below to find specific information within the annual report.-
 1
1 -
2
-
3
-
4
-
5
-
6
-
7
-
8
-
9
-
10
-
11
-
12
-
13
-
14
-
15
-
16
-
17
-
18
-
19
-
20
-
21
-
22
-
23
-
24
-
25
-
26
-
27
-
28
-
29
-
30
-
31
-
 32
32 -
 33
33 -
 34
34 -
 35
35 -
 36
36 -
 37
37 -
 38
38 -
 39
39 -
 40
40 -
 41
41 -
 42
42 -
 43
43 -
 44
44 -
 45
45 -
 46
46 -
 47
47 -
 48
48 -
 49
49 -
 50
50 -
 51
51 -
 52
52 -
53
-
54
-
55
-
56
-
57
-
58
-
59
-
60
 |
 |

RADIOSHACK 2003 Annual Report
40
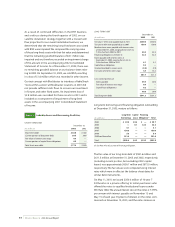
have some concentration of credit risk from service
providers in the wireless telephone and DTH satellite services
industries, due to sales of their products and services.
We maintain an allowance for doubtful accounts where
accounts are determined to be uncollectible and, histori-
cally, such losses, in the aggregate, have not exceeded our
expectations.
Inventories: Inventories are stated at the lower of cost
(principally based on average cost) or market value and are
comprised primarily of finished goods.
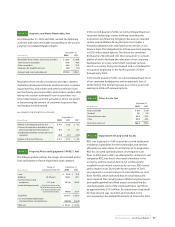
Property,Plant and Equipment: Property, plant and equipment
are stated at cost, less accumulated depreciation and amor-
tization. For financial reporting purposes, depreciation and
amortization are primarily calculated using the straight-line
method, which amortizes the cost of the assets over their
estimated useful lives.When depreciable assets are sold or
retired, the related cost and accumulated depreciation are
removed from the accounts and gains and losses are recog-
nized.Major additions and betterments are capitalized.
Maintenance and repairs which do not materially improve
or extend the lives of the respective assets are charged to
operating expenses as incurred. Amortization of buildings
under capital leases is included in depreciation and amorti-
zation in the Consolidated Statements of Income.
Capitalized Software Costs: We capitalize qualifying costs
related to developing internal-use software. Capitalization
of costs begins after the conceptual formulation stage has
been completed. Capitalized costs are amortized over the
estimated useful life of the software, which ranges between
three and five years. Capitalized software costs at
December 31, 2003, 2002 and 2001, totaled $37.9 million,
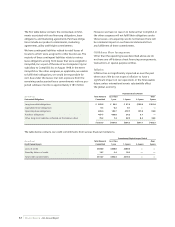
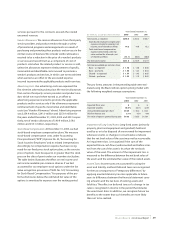
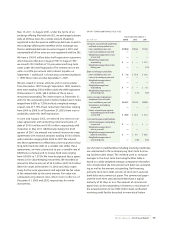
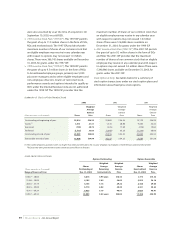
Earnings per Share: Basic earnings per share is computed
based only on the weighted average number of common
shares outstanding for each period presented. Diluted
earnings per share reflects the potential dilution that
would have occurred if securities or other contracts to issue
common stock were exercised, converted, or resulted in
the issuance of common stock that would have then shared
in the earnings of the entity.The table above reconciles the
numerator and denominator used in the basic and diluted
earnings per share calculations.
Options to purchase 16.8 million, 18.1 million and 12.2 mil-
lion shares of common stock in 2003, 2002 and 2001,
respectively, were not included in the computation of diluted
earnings per common share because the option exercise
price was greater than the average market price of the
common stock during the year.
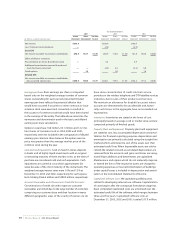
Cash and Cash Equivalents: Cash on hand in stores, deposits
in banks and all highly liquid investments with an original
or remaining maturity of three months or less at the time of
purchase are considered cash and cash equivalents. Cash
equivalents are carried at cost, which approximates fair
value because of the short maturity of the instruments.The
weighted average interest rates were 1.0% and 1.3% at
December 31, 2003 and 2002, respectively, for cash equiva-
lents totaling $566.4 million and $398.3 million, respectively.
Accounts Receivable and Allowance for Doubtful Accounts:
Concentrations of credit risk with respect to customer
receivables are limited due to the large number of customers
comprising our customer base and their location in many
different geographic areas of the country. However, we do
Year Ended December 31,
2003 2002 2001
Income Shares Per Share Income Shares Per Share Income Shares Per Share
(In millions, except per share amounts) (Numerator) (Denominator) Amount (Numerator) (Denominator) Amount (Numerator) (Denominator) Amount
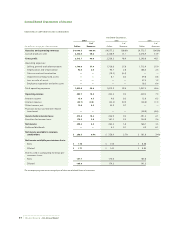
Net income $298.5 $263.4 $166.7
Less: Preferred stock dividends —(4.5) (4.9)
Basic EPS
Net income available to common stockholders 298.5 167.7 $1.78 258.9 173.0 $1.50 161.8 183.8 $ 0.88
Effect of dilutive securities:
Plus dividends on Series B preferred stock —4.5 4.9
Additional contribution required if preferred
stock had been converted —— (3.3) 5.3 (3.5) 5.8
Stock options 1.2 1.0 1.6
Diluted EPS
Net income available to common stockholders
plus assumed conversions $298.5 168.9 $1.77 $260.1 179.3 $1.45 $163.2 191.2 $0.85