Radio Shack 2003 Annual Report Download - page 31
Download and view the complete annual report
Please find page 31 of the 2003 Radio Shack annual report below. You can navigate through the pages in the report by either clicking on the pages listed below, or by using the keyword search tool below to find specific information within the annual report.-
 1
1 -
2
-
3
-
4
-
5
-
6
-
7
-
8
-
9
-
10
-
11
-
12
-
13
-
14
-
15
-
16
-
17
-
18
-
19
-
20
-
 21
21 -
 22
22 -
 23
23 -
 24
24 -
 25
25 -
 26
26 -
 27
27 -
 28
28 -
 29
29 -
 30
30 -
 31
31 -
 32
32 -
 33
33 -
 34
34 -
 35
35 -
 36
36 -
 37
37 -
 38
38 -
 39
39 -
 40
40 -
 41
41 -
42
-
43
-
44
-
45
-
46
-
47
-
48
-
49
-
50
-
51
-
52
-
53
-
54
-
55
-
56
-
57
-
58
-
59
-
60
 |
 |

RADIOSHACK 2003 Annual Report 29
Typically, our annual cash requirements for pre-seasonal
inventory build-up range between $200.0 million and
$400.0 million.The funding required for this build-up
comes primarily from cash on hand and cash generated
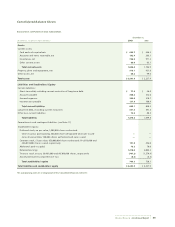
from net sales and operating revenues.We had $634.7 mil-
lion in cash and cash equivalents as of December 31, 2003,
as a resource for our funding needs. Additional capital is
available under our $600.0 million commercial paper pro-
gram, which is supported by a bank credit facility that
could be utilized in the event the commercial paper market
is unavailable to us.We currently do not expect, however,
the commercial paper market to become unavailable to us
or that we will have to utilize the credit facility. As of
December 31, 2003, we had no commercial paper outstand-
ing or other utilization of our credit facility.
During the year ended December 31, 2003, $118.7 million
less in cash was provided by accounts payable due to lower
inventory levels than in the prior year. Additionally, $29.6
million more in cash was provided by accrued expenses
and $12.7 million more in cash was provided by reduced
income taxes payable, compared to the prior year.
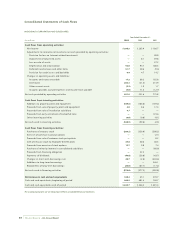
Cash used in investing activities in 2003 was $188.9 million,
compared to $99.0 million and $2.3 million used in 2002
and 2001, respectively. Capital expenditures were $189.6
million in 2003, compared to $106.8 million in 2002 and
$139.2 million in 2001. Capital expenditures for 2003
increased over the prior two years, primarily due to the
construction of our new corporate campus, while capital
expenditures for both 2002 and 2001 were primarily for our
retail store expansions and remodels and upgrades of
information systems. We also had capital expenditures
relating to retail stores and information systems in 2003. In
addition, we purchased land costing $18.3 million in 2001
for our new corporate headquarters building.We anticipate
that our capital expenditure requirements for 2004 will be
approximately $300.0 million.The $110.0 million increase
over 2003 primarily relates to our new corporate headquar-
ters. Store remodels and relocations and updated
information systems account for the almost half of the balance
of our anticipated 2004 capital expenditures. See further
discussion of our new facilities below in the section titled
“Capital Structure and Financial Condition.” As of
December 31, 2003, we had $634.7 million in cash and cash
equivalents.These cash and cash equivalents, along with
cash generated from our net sales and operating revenues
and, if necessary, both our short-term and long-term
financing facilities, are available to fund future capital
expenditure needs.
Cash used in financing activities was $274.8 million in 2003,
compared to $377.5 million and $502.8 million in 2002
and 2001, respectively. We used $286.2 million for the
repurchase of our common stock in 2003 and $329.9 mil-
lion and $308.3 million for the repurchase of our common
and preferred stock in 2002 and 2001, respectively.
Repurchases of common stock were made under our share
repurchase and employee stock programs. See the further
discussion of our stock repurchase programs below in the
section titled “Capital Structure and Financial Condition.”
The 2003, 2002 and 2001 stock repurchases were partially
funded by $51.5 million, $49.6 million and $53.7 million,
respectively, received from the sale of treasury stock to
employee benefit plans and, to a lesser extent, from stock
option exercises.The balance of capital to repurchase
shares was obtained from cash generated from operations.
We received $32.3 million from the sale and lease-back of
our corporate technology center building during the
second quarter of 2002.This transaction was recorded as a
financing obligation due to responsibilities which we retain
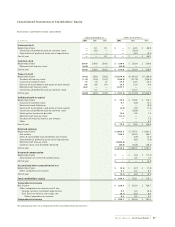
during the lease period. Dividends paid, net of tax, in 2003,
2002 and 2001 amounted to $40.8 million, $39.8 million
and $43.7 million, respectively.
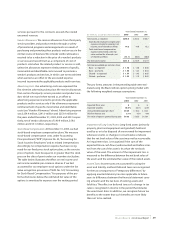
Our free cash flow, defined as cash flows from operating
activities less dividends paid and additions to property,
plant and equipment, was $421.5 million in 2003, compared
to $375.0 million in 2002.This increase in free cash flow,
when compared to the prior year, was the result of supply
chain initiatives, including a greater focus on reducing
inventory weeks-of-supply.The increase was partially offset
by the increase in capital expenditures related to our new
corporate campus.We expect free cash flow to be approxi-
mately $70.0 million in 2004.The decrease from 2003 is
based primarily on the timing of capital expenditures for
our new corporate headquarters; the majority of which we
originally thought would have been included in our 2003
capital expenditures.The major portion of our new corpo-
rate campus expenditures will now be part of our 2004
capital expenditures. After 2004, we anticipate a return to a
more historical free cash flow level of $200.0 million to
$250.0 million, annually.
We believe free cash flow is an appropriate indication of
our ability to fund share repurchases, repay maturing debt,
change dividend payments or fund other uses of capital
that management believes will enhance shareholder value.
The comparable financial measure to free cash flow under
generally accepted accounting principles is cash flows from
operating activities, which were $651.9 million in 2003,
compared to $521.6 million in 2002.We do not intend the