Radio Shack 2003 Annual Report Download - page 26
Download and view the complete annual report
Please find page 26 of the 2003 Radio Shack annual report below. You can navigate through the pages in the report by either clicking on the pages listed below, or by using the keyword search tool below to find specific information within the annual report.-
 1
1 -
2
-
3
-
4
-
5
-
6
-
7
-
8
-
9
-
10
-
11
-
12
-
13
-
14
-
15
-
 16
16 -
 17
17 -
 18
18 -
 19
19 -
 20
20 -
 21
21 -
 22
22 -
 23
23 -
 24
24 -
 25
25 -
 26
26 -
 27
27 -
 28
28 -
 29
29 -
 30
30 -
 31
31 -
 32
32 -
 33
33 -
 34
34 -
 35
35 -
 36
36 -
37
-
38
-
39
-
40
-
41
-
42
-
43
-
44
-
45
-
46
-
47
-
48
-
49
-
50
-
51
-
52
-
53
-
54
-
55
-
56
-
57
-
58
-
59
-
60
 |
 |

RADIOSHACK 2003 Annual Report
24
same due to fewer company stores and our continued rent
reduction efforts. We expect a similar increase in 2004 rent
for the same reasons described for 2003.
Insurance expense increased $10.5 million to $81.5 million
in 2003 from $71.0 million in 2002 and increased as a per-
cent of net sales and operating revenues to 1.8% in 2003,
compared to 1.6% in 2002. Substantially all of our insurance
expense relates to our self-insurance programs.We main-
tain reserves for self-insurance liabilities related to our
group medical and casualty losses, which include general
and product liability and workers’ compensation. In some
cases, risks are insured through outside carriers for losses in
excess of self-insured amounts.These reserves are adjusted
to reflect estimates based on historical experience, estimated
claims incurred but not yet reported, the impact of risk
management programs, and the estimated effect of external
factors. As of December 31, 2003, actual losses had not
exceeded our expectations.
In 2004, we expect SG&A expense to increase slightly in
dollars, but decrease slightly as a percentage of net sales
and operating revenues, due to increased sales volume and
a continued focus on leveraging our fixed expense base.
Depreciation and Amortization
Depreciation and amortization expense decreased $2.7 mil-
lion dollars to $92.0 million and remained at 2.0% of net
sales and operating revenues for both 2003 and 2002. We
expect depreciation and amortization expense to increase
slightly in 2004, due to depreciation increases associated
with new store fixtures, capitalized software related to
inventory management, and information systems projects.
Gain on Contract Termination
There was no gain on contract termination in 2003. For
information on the prior year gain on contract termination,
see the discussion below under the section titled “2002
Compared with 2001.”
Impairment of Long-Lived Assets
There was no impairment of long-lived assets in 2003.For
information on the prior year impairment of long-lived
assets, see the discussion below under the section titled
“2002 Compared with 2001.”
Net Interest Expense
Interest expense, net of interest income, was $22.9 million
for 2003 versus $34.4 million for 2002, a decrease of $11.5
million or 33.4%.
Interest expense decreased to $35.7 million in 2003 from
$43.4 million in 2002.This decrease was primarily the result
of a reduction in the average debt outstanding throughout
2003. In addition, our interest rate swap instruments and
the capitalization of $2.6 million of interest expense related
to the construction of our new corporate campus also low-
ered overall interest expense for the year ended December
31, 2003, when compared to the same prior year period.
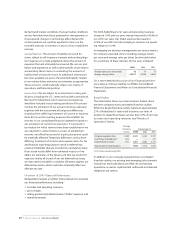
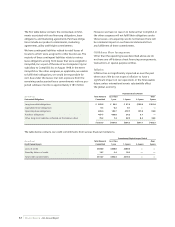
Interest income increased over 42% to $12.8 million in
2003 from $9.0 million in 2002, primarily as a result of a
$5.6 million increase in interest received from tax settlements
in 2003, as compared to 2002. Interest income, including
accretion of discount as applicable, earned on the amounts
outstanding during the three years ended December 31,
2003, 2002 and 2001, was as follows:
Year Ended December 31,
(In millions) 2003 2002 2001
CompUSA note receivable $— $ — $ 6.1
Other (includes short-term
investment interest) 12.8 9.0 6.9
Total interest income $12.8 $9.0 $13.0
Interest expense, net of interest income, is expected to
decrease in 2004, when compared to 2003.
Other Income, Net
On July 28, 2003, we received payment of $15.7 million
resulting from the favorable settlement of a lawsuit we had
previously filed.We recorded this settlement in the third
quarter of 2003 as other income of $10.7 million, net of
legal expenses of $5.0 million paid as a result of the lawsuit.
On September 10, 2003, we sold our wholly-owned sub-
sidiary, AmeriLink Corp. (“AmeriLink”), also referred to as
RSIS, to INSTALLS inc, LLC in a cash-for-stock sale, resulting
in a loss of $1.8 million, based on AmeriLink’s book value,
which was recorded in other income.
For the year ended December 31, 2003, we received and
recorded income of $3.1 million owed to us under a tax
sharing agreement with O’Sullivan Industries Holdings, Inc.
(“O’Sullivan”), compared to $33.9 million received and
recorded in the corresponding prior year period. In the
second quarter of 2002, we received and recorded income
of $27.7 million in partial settlement of amounts owed to
us under this tax sharing agreement that was the subject of
an arbitration dispute with O’Sullivan.This partial settle-
ment followed a ruling in our favor by the arbitration panel.