Radio Shack 2003 Annual Report Download - page 23
Download and view the complete annual report
Please find page 23 of the 2003 Radio Shack annual report below. You can navigate through the pages in the report by either clicking on the pages listed below, or by using the keyword search tool below to find specific information within the annual report.-
 1
1 -
2
-
3
-
4
-
5
-
6
-
7
-
8
-
9
-
10
-
11
-
12
-
 13
13 -
 14
14 -
 15
15 -
 16
16 -
 17
17 -
 18
18 -
 19
19 -
 20
20 -
 21
21 -
 22
22 -
 23
23 -
 24
24 -
 25
25 -
 26
26 -
 27
27 -
 28
28 -
 29
29 -
 30
30 -
 31
31 -
 32
32 -
 33
33 -
34
-
35
-
36
-
37
-
38
-
39
-
40
-
41
-
42
-
43
-
44
-
45
-
46
-
47
-
48
-
49
-
50
-
51
-
52
-
53
-
54
-
55
-
56
-
57
-
58
-
59
-
60
 |
 |

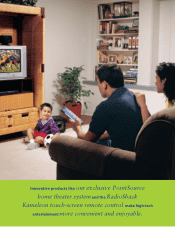
primarily the result of a 14.3% increase in wireless depart-
ment sales, partially offset by a decline in sales within the
home entertainment department.These sales increases were
possible because of an increase in average store volume,
despite a decrease in 2003 of 40 company stores, net of
store openings.We expect a sales gain for 2004 as discussed
in further detail below.
Sales to our dealer/franchise outlets, in addition to retail
support operations and other sales, were down $31.1 million
for 2003, or a decrease of 9.4%, when compared to 2002.
Sales to our dealer/franchise outlets remain substantially
less than 10% of our total sales. Retail support operation
sales are generated primarily from outside sales of our
repair centers, RadioShack Installation Services (“RSIS”), and
domestic and overseas manufacturing.The decrease in
retail support operations sales from 2002 to 2003 primarily
resulted from an overall decline in our RSIS commercial
business,the closure of several of our manufacturing facilities
in the third quarter of 2003, and the sale of RSIS in
September 2003.We expect 2004 sales from dealer/franchise
RADIOSHACK 2003 Annual Report 21
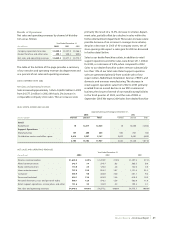
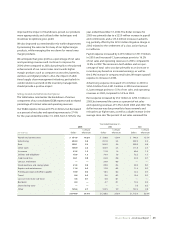
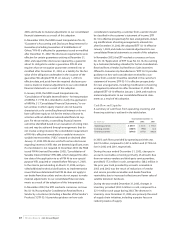
REAL ESTATE OWNED AND LEASED
Approximate Square Footage at December 31,
2003
2002
(In thousands) Owned Leased Total
Owned Leased Total
Retail
RadioShack 18 12,417 12,435 18 12,486 12,504
Support Operations
Manufacturing 157 208 365 502 201 703
Distribution centers and office space 2,610 2,557 5,167 3,022 2,481 5,503
2,785 15,182 17,967 3,542 15,168 18,710
NET SALES AND OPERATING REVENUES
Year Ended December 31,
(In millions) 2003
2002 2001
Wireless communication $1,623.2 34.9% $ 1,419.9 31.0% $1,297.5 27.2%
Wired communication 343.7 7.4 379.7 8.3 383.5 8.0
Radio communication 114.8 2.5 120.6 2.6 132.0 2.8
Home entertainment 737.9 15.9 855.2 18.7 1,121.4 23.5
Computer 455.9 9.8 456.8 10.0 461.1 9.6
Power and technical 634.1 13.6 623.9 13.6 618.9 13.0
Personal electronics, toys and personal audio 588.1 12.6 576.2 12.6 562.0 11.8
Retail support operations, service plans, and other 151.6 3.3 144.9 3.2 199.3 4.1
Net sales and operating revenues $4,649.3 100.0% $ 4,577.2 100.0% $4,775.7 100.0%
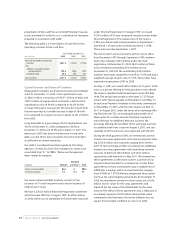
Results of Operations
Net sales and operating revenues by channel of distribu-
tion are as follows:
Year Ended December 31,
(In millions) 2003
2002 2001
Company-operated store sales $ 4,350.2 $4,247.0 $4,266.2
Dealer/franchise and other sales 299.1 330.2 509.5
Net sales and operating revenues $ 4,649.3 $4,577.2 $4,775.7
The table at the bottom of the page provides a summary
of our net sales and operating revenues by department and
as a percent of net sales and operating revenues.
2003 COMPARED WITH 2002
Net Sales and Operating Revenues
Sales increased approximately 1.6% to $4,649.3 million in 2003
from $4,577.2 million in 2002.We had a 2% increase in
comparable company store sales.These increases were