Radio Shack 2003 Annual Report Download - page 22
Download and view the complete annual report
Please find page 22 of the 2003 Radio Shack annual report below. You can navigate through the pages in the report by either clicking on the pages listed below, or by using the keyword search tool below to find specific information within the annual report.-
 1
1 -
2
-
3
-
4
-
5
-
6
-
7
-
8
-
9
-
10
-
11
-
 12
12 -
 13
13 -
 14
14 -
 15
15 -
 16
16 -
 17
17 -
 18
18 -
 19
19 -
 20
20 -
 21
21 -
 22
22 -
 23
23 -
 24
24 -
 25
25 -
 26
26 -
 27
27 -
 28
28 -
 29
29 -
 30
30 -
 31
31 -
 32
32 -
33
-
34
-
35
-
36
-
37
-
38
-
39
-
40
-
41
-
42
-
43
-
44
-
45
-
46
-
47
-
48
-
49
-
50
-
51
-
52
-
53
-
54
-
55
-
56
-
57
-
58
-
59
-
60
 |
 |

RADIOSHACK 2003 Annual Report
20
demand and market conditions. If actual market conditions
are less favorable than those projected by management, or
if unexpected changes in technology affect demand for
certain products, we could be exposed to losses on the
recorded amounts in inventory in excess of our established
reserves.
Accrued Expenses: The amount of liability we record for
claims related to self insurance, warranty and pending litiga-
tion requires us to make judgments about the amount of
expenses that will ultimately be incurred.We use our past
history and experience,as well as other specific circumstances
surrounding these claims, in evaluating the amount of
liability that we should record. As additional information
becomes available, we assess the potential liability related
to our various claims and revise our estimates as appropriate.
These revisions could materially impact our results of
operations and financial position.
Income Taxes: We are subject to income taxes in many juris-
dictions, including the U.S., states and localities, and abroad.
We must first determine which revenues and expenses
should be included in each taxing jurisdiction. This process
involves the estimation of our actual current tax exposure,
together with the assessment of temporary differences
resulting from differing treatment of income or expense
items for tax and accounting purposes.We establish tax
reserves in our consolidated financial statements based on
our estimation of current tax exposures. If we prevail in
tax matters for which reserves have been established or we
are required to settle matters in excess of established
reserves, our effective tax rate for a particular period could
be materially affected.Temporary differences arising from
differing treatment of income and expense items for tax
and financial reporting purposes result in deferred tax
assets and liabilities that are recorded on our balance sheet.
If our actual results differ from estimated results or if we
adjust our estimates in the future such that we would not
expect to realize all or part of our net deferred tax assets,
we may need to establish a valuation allowance against our
deferred tax assets, which could also materially affect our
effective tax rate.
Overview of 2003 Financial Performance
Management reviews a number of key indicators to evaluate
our financial performance, including:
>net sales and operating revenues,
>gross margin,
>selling, general and administrative (“SG&A”) expense, and
>operating margin.
For 2003, RadioShack’s net sales and operating revenues
increased 1.6%, and our gross margin improved to 49.8% of
our 2003 net sales. Our SG&A expense decreased to
37.4% of our 2003 net sales, helping to increase our operat-
ing margin to 10.4%.
In managing our business, management uses various metrics
for company operated stores, including average tickets
per store and average sales per ticket. See the table below
for a summary of these statistics for the years indicated.
2003 2002 2001
Average tickets per store per day 72 73 71
Average sales per ticket $30.77 $29.40 $30.41
For a more detailed discussion of our financial perform-
ance, please continue reading our MD&A, Consolidated
Financial Statements and Notes to Consolidated Financial
Statements.
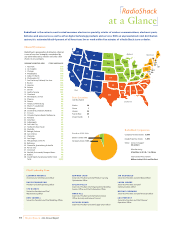
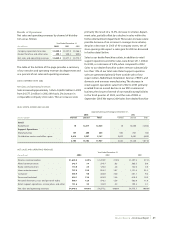
Retail Outlets
The table below shows our retail locations broken down
between company stores and dealer/franchise outlets.
While the dealer/franchise outlets represent approximately
27% of RadioShack’s total retail locations, our sales of
product to dealer/franchisees are less than 10% of our total
net sales and operating revenues (see “Results of
Operations”below).
Average
Store Size At December 31,
(Sq. Ft.) 2003 2002 2001
Company-operated stores 2,439 5,121 5,161 5,127
Cool Things @ Blockbuster (1) N/A —— 127
Dealer/franchise outlets N/A 1,921 2,052 2,119
Total number of retail locations 7,042 7,213 7,373
(1) Test stores closed in early 2002.
In addition to our company operated stores and dealer/
franchise outlets, our existing and emerging sales channels
include our www.radioshack.com Web site and catalog
operations, as well as sophisticated outbound and inbound
telephone call centers.