Radio Shack 2003 Annual Report Download - page 56
Download and view the complete annual report
Please find page 56 of the 2003 Radio Shack annual report below. You can navigate through the pages in the report by either clicking on the pages listed below, or by using the keyword search tool below to find specific information within the annual report.-
 1
1 -
2
-
3
-
4
-
5
-
6
-
7
-
8
-
9
-
10
-
11
-
12
-
13
-
14
-
15
-
16
-
17
-
18
-
19
-
20
-
21
-
22
-
23
-
24
-
25
-
26
-
27
-
28
-
29
-
30
-
31
-
32
-
33
-
34
-
35
-
36
-
37
-
38
-
39
-
40
-
41
-
42
-
43
-
44
-
45
-
 46
46 -
 47
47 -
 48
48 -
 49
49 -
 50
50 -
 51
51 -
 52
52 -
 53
53 -
 54
54 -
 55
55 -
 56
56 -
 57
57 -
 58
58 -
 59
59 -
 60
60
 |
 |

RADIOSHACK 2003 Annual Report
54
quarter being the most significant in terms of sales and
profits because of the winter holiday selling season.
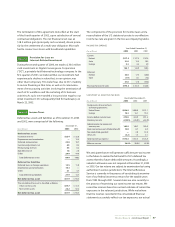
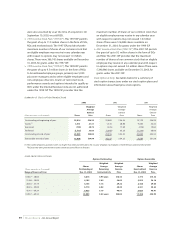
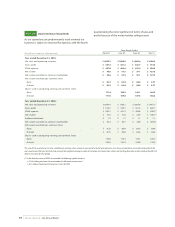
Note 29 Quarterly Data (Unaudited)
As our operations are predominantly retail oriented, our
business is subject to seasonal fluctuations, with the fourth
Three Months Ended
(In millions, except per share amounts)
March 31 June 30 Sept. 30 Dec. 31
Year ended December 31, 2003:
Net sales and operating revenues $1,070.3 $1,025.0 $1,063.6 $1,490.4
Gross profit $ 527.4 $ 521.2 $ 532.7 $ 734.4
SG&A expense $ 407.8 $ 406.6 $ 421.4 $ 504.2
Net income $ 56.6 $ 57.5 $ 57.1 $ 127.3
Net income available to common stockholders $ 56.6 $ 57.5 $ 57.1 $ 127.3
Net income available per common share:
Basic $ 0.33 $ 0.34 $ 0.34 $ 0.77
Diluted $ 0.33 $ 0.34 $ 0.34 $ 0.77
Shares used in computing earnings per common share:
Basic 171.4 168.9 166.1 164.5
Diluted 171.8 169.8 167.6 166.3
Year ended December 31, 2002:
Net sales and operating revenues $1,034.4 $ 998.1 $1,047.0 $ 1,497.7
Gross profit $ 519.7 $ 510.1 $ 521.4 $ 687.1
SG&A expense $ 393.2 $ 421.3 $ 420.0 $ 483.7(1)
Net income $ 57.6 $ 51.8 $ 44.9 $ 109.1(1)
Preferred dividends $ 1.2 $ 1.1 $ 1.1 $ 1.1
Net income available to common stockholders $ 56.4 $ 50.7 $ 43.8 $ 108.0
Net income available per common share:
Basic $ 0.32 $ 0.29 $ 0.25 $ 0.64
Diluted $ 0.31 $ 0.28 $ 0.25 $ 0.63
Shares used in computing earnings per common share:
Basic 176.8 174.4 172.1 168.7
Diluted 183.6 181.5 178.0 174.2
The sum of the quarterly net income available per common share amounts may not total to full year amounts, since these computations are made independently for
each quarter and full year and take into account the weighted average number of common stock equivalent shares outstanding for each period, including the effect of
dilutive securities for that period.
(1) In the fourth quarter of 2002, we recorded the following significant items:
>$18.5 million gain from the termination of a Microsoft contract and
> $8.1 million impairment of long-lived assets for RSIS.