Radio Shack 2003 Annual Report Download - page 25
Download and view the complete annual report
Please find page 25 of the 2003 Radio Shack annual report below. You can navigate through the pages in the report by either clicking on the pages listed below, or by using the keyword search tool below to find specific information within the annual report.-
 1
1 -
2
-
3
-
4
-
5
-
6
-
7
-
8
-
9
-
10
-
11
-
12
-
13
-
14
-
 15
15 -
 16
16 -
 17
17 -
 18
18 -
 19
19 -
 20
20 -
 21
21 -
 22
22 -
 23
23 -
 24
24 -
 25
25 -
 26
26 -
 27
27 -
 28
28 -
 29
29 -
 30
30 -
 31
31 -
 32
32 -
 33
33 -
 34
34 -
 35
35 -
36
-
37
-
38
-
39
-
40
-
41
-
42
-
43
-
44
-
45
-
46
-
47
-
48
-
49
-
50
-
51
-
52
-
53
-
54
-
55
-
56
-
57
-
58
-
59
-
60
 |
 |

RADIOSHACK 2003 Annual Report 23
improved the impact of markdowns, priced our products
more appropriately, and utilized other techniques and
incentives to optimize gross profit.
We also improved our merchandise mix within departments
by increasing the sales mix for many of our higher margin
products, while managing the mix down for many lower
margin products.
We anticipate that gross profit as a percentage of net sales
and operating revenues will continue to improve for
2004, when compared to 2003, due primarily to the planned
enhancement of our current sales mix towards higher
margin products such as computer accessories, batteries,
wellness and digital products. Also, the impact of addi-
tional supply chain management initiatives, particularly in
vendor relations and end-of-life inventory management,
should provide a positive impact.
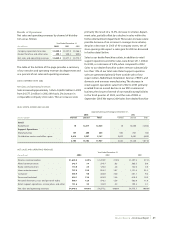
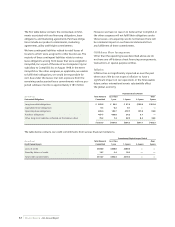
Selling, General and Administrative Expense
The table below summarizes the breakdown of various
components of our consolidated SG&A expense and its related
percentage of total net sales and operating revenues.
Our SG&A expense increased 0.7% in dollars, but decreased
as a percent of net sales and operating revenues to 37.4%
for the year ended December 31, 2003, from 37.8% for the
year ended December 31, 2002. The dollar increase for
2003 was primarily due to a $23.9 million increase in payroll
and commissions and a $13.4 million increase in advertis-
ing, partially offset by the $29.0 million litigation charge in
2002 related to the settlement of a class action lawsuit
in California.
Payroll expense increased by $23.9 million to $751.9 million
in 2003 and increased 0.3 percentage points to 16.2%
of net sales and operating revenues in 2003, compared to
15.9% in 2002.The increase in both dollars and as a per-
centage of total sales was due primarily to an increase in
incentive pay based on increased earnings, as well as
the 2.4% increase in company retail sales.We expect payroll
expense to increase in 2004.
Advertising expense increased $13.4 million in 2003 to
$254.4 million from $241.0 million in 2002 and increased
0.2 percentage points to 5.5% of net sales and operating
revenues in 2003, compared to 5.3% in 2002.
Rent expense increased by $5.2 million to $250.1 million in
2003, but remained the same as a percent of net sales
and operating revenues of 5.4% in both 2003 and 2002.The
dollar increase was due primarily to lease renewals and
relocations at higher rates, as well as a slight increase in the
average store size.The percent of net sales remained the
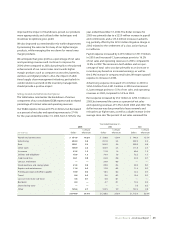
Year Ended December 31,
2003
2002 2001
% of Sales % of Sales % of Sales
(In millions)
Dollars & Revenues Dollars & Revenues Dollars & Revenues
Payroll and commissions $ 751.9 16.2% $ 728.0 15.9% $ 740.3 15.5%
Advertising 254.4 5.5 241.0 5.3 253.9 5.3
Rent 250.1 5.4 244.9 5.4 230.3 4.8
Other taxes 106.9 2.3 105.9 2.3 111.8 2.4
Insurance 81.5 1.8 71.0 1.6 60.6 1.3
Utilities and telephone 75.8 1.6 74.9 1.6 73.2 1.5
Credit card fees 36.1 0.8 35.8 0.8 34.9 0.7
Lawsuit settlement —— 29.0 0.6 — —
Stock purchase and savings plans 21.5 0.4 20.8 0.5 20.3 0.4
Repairs and maintenance 11.6 0.2 12.0 0.3 11.4 0.2
Printing, postage and office supplies 10.0 0.2 10.5 0.2 12.2 0.3
Travel 8.6 0.2 9.6 0.2 10.4 0.2
Loss on real estate sub-lease 5.6 0.1 6.0 0.1 — —
Bad debt 0.4 — 4.7 0.1 14.5 0.3
Store closing costs —— — — 7.6 0.2
Other 125.6 2.7 134.5 2.9 132.5 2.8
$1,740.0 37.4% $1,728.6 37.8% $1,713.9 35.9%