Memorex 2009 Annual Report Download - page 89
Download and view the complete annual report
Please find page 89 of the 2009 Memorex annual report below. You can navigate through the pages in the report by either clicking on the pages listed below, or by using the keyword search tool below to find specific information within the annual report.-
 1
1 -
2
-
3
-
4
-
5
-
6
-
7
-
8
-
9
-
10
-
11
-
12
-
13
-
14
-
15
-
16
-
17
-
18
-
19
-
20
-
21
-
22
-
23
-
24
-
25
-
26
-
27
-
28
-
29
-
30
-
31
-
32
-
33
-
34
-
35
-
36
-
37
-
38
-
39
-
40
-
41
-
42
-
43
-
44
-
45
-
46
-
47
-
48
-
49
-
50
-
51
-
52
-
53
-
54
-
55
-
56
-
57
-
58
-
59
-
60
-
61
-
62
-
63
-
64
-
65
-
66
-
67
-
68
-
69
-
70
-
71
-
72
-
73
-
74
-
75
-
76
-
77
-
78
-
 79
79 -
 80
80 -
 81
81 -
 82
82 -
 83
83 -
 84
84 -
 85
85 -
 86
86 -
 87
87 -
 88
88 -
 89
89 -
 90
90 -
 91
91 -
 92
92 -
 93
93 -
 94
94 -
 95
95 -
 96
96 -
 97
97 -
 98
98 -
 99
99 -
100
-
101
-
102
-
103
-
104
-
105
-
106
-
107
-
108
 |
 |

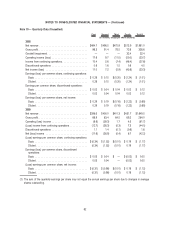
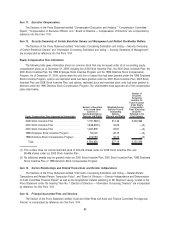
Note 19 — Quarterly Data (Unaudited)
First Second Third Fourth Total(1)
(In millions, except per share amounts)
2008
Net revenue . . . . . . . . . . . . . . . . . . . . . . . . . . . . . . . . $494.7 $496.5 $475.9 $513.9 $1,981.0
Gross profit. . . . . . . . . . . . . . . . . . . . . . . . . . . . . . . . . 96.3 91.4 78.5 72.6 338.8
Goodwill impairment . . . . . . . . . . . . . . . . . . . . . . . . . . . — — — 32.4 32.4
Operating income (loss) . . . . . . . . . . . . . . . . . . . . . . . . 17.6 9.7 (11.0) (50.0) (33.7)
Income from continuing operations. . . . . . . . . . . . . . . . . 10.4 5.6 (7.4) (46.4) (37.8)
Discontinued operations . . . . . . . . . . . . . . . . . . . . . . . . 0.6 1.6 1.5 0.8 4.5
Net income (loss) . . . . . . . . . . . . . . . . . . . . . . . . . . . . 11.0 7.2 (5.9) (45.6) (33.3)
Earnings (loss) per common share, continuing operations:
Basic . . . . . . . . . . . . . . . . . . . . . . . . . . . . . . . . . . . $ 0.28 $ 0.15 $ (0.20) $ (1.24) $ (1.01)
Diluted . . . . . . . . . . . . . . . . . . . . . . . . . . . . . . . . . . 0.28 0.15 (0.20) (1.24) (1.01)
Earnings per common share, discontinued operations:
Basic . . . . . . . . . . . . . . . . . . . . . . . . . . . . . . . . . . . $ 0.02 $ 0.04 $ 0.04 $ 0.02 $ 0.12
Diluted . . . . . . . . . . . . . . . . . . . . . . . . . . . . . . . . . . 0.02 0.04 0.04 0.02 0.12
Earnings (loss) per common share, net income:
Basic . . . . . . . . . . . . . . . . . . . . . . . . . . . . . . . . . . . $ 0.29 $ 0.19 $ (0.16) $ (1.22) $ (0.89)
Diluted . . . . . . . . . . . . . . . . . . . . . . . . . . . . . . . . . . 0.29 0.19 (0.16) (1.22) (0.89)
2009
Net revenue . . . . . . . . . . . . . . . . . . . . . . . . . . . . . . . . $396.5 $400.0 $401.3 $451.7 $1,649.5
Gross profit. . . . . . . . . . . . . . . . . . . . . . . . . . . . . . . . . 66.9 63.4 64.5 69.2 264.0
Operating (loss) income . . . . . . . . . . . . . . . . . . . . . . . . (8.6) (59.3) 1.7 4.5 (61.7)
(Loss) income from continuing operations . . . . . . . . . . . . (12.7) (38.3) (0.3) 7.3 (44.0)
Discontinued operations . . . . . . . . . . . . . . . . . . . . . . . . 1.1 1.4 (0.1) (0.6) 1.8
Net (loss) income . . . . . . . . . . . . . . . . . . . . . . . . . . . . (11.6) (36.9) (0.4) 6.7 (42.2)
(Loss) earnings per common share, continuing operations:
Basic . . . . . . . . . . . . . . . . . . . . . . . . . . . . . . . . . . . $ (0.34) $ (1.02) $ (0.01) $ 0.19 $ (1.17)
Diluted . . . . . . . . . . . . . . . . . . . . . . . . . . . . . . . . . . (0.34) (1.02) (0.01) 0.19 (1.17)
Earnings (loss) per common share, discontinued
operations:
Basic . . . . . . . . . . . . . . . . . . . . . . . . . . . . . . . . . . . $ 0.03 $ 0.04 $ — $ (0.02) $ 0.05
Diluted . . . . . . . . . . . . . . . . . . . . . . . . . . . . . . . . . . 0.03 0.04 — (0.02) 0.05
(Loss) earnings per common share, net income:
Basic . . . . . . . . . . . . . . . . . . . . . . . . . . . . . . . . . . . $ (0.31) $ (0.98) $ (0.01) $ 0.18 $ (1.12)
Diluted . . . . . . . . . . . . . . . . . . . . . . . . . . . . . . . . . . (0.31) (0.98) (0.01) 0.18 (1.12)
(1) The sum of the quarterly earnings per share may not equal the annual earnings per share due to changes in average
shares outstanding.
82
NOTES TO CONSOLIDATED FINANCIAL STATEMENTS — (Continued)