Memorex 2009 Annual Report Download - page 33
Download and view the complete annual report
Please find page 33 of the 2009 Memorex annual report below. You can navigate through the pages in the report by either clicking on the pages listed below, or by using the keyword search tool below to find specific information within the annual report.-
 1
1 -
2
-
3
-
4
-
5
-
6
-
7
-
8
-
9
-
10
-
11
-
12
-
13
-
14
-
15
-
16
-
17
-
18
-
19
-
20
-
21
-
22
-
 23
23 -
 24
24 -
 25
25 -
 26
26 -
 27
27 -
 28
28 -
 29
29 -
 30
30 -
 31
31 -
 32
32 -
 33
33 -
 34
34 -
 35
35 -
 36
36 -
 37
37 -
 38
38 -
 39
39 -
 40
40 -
 41
41 -
 42
42 -
 43
43 -
44
-
45
-
46
-
47
-
48
-
49
-
50
-
51
-
52
-
53
-
54
-
55
-
56
-
57
-
58
-
59
-
60
-
61
-
62
-
63
-
64
-
65
-
66
-
67
-
68
-
69
-
70
-
71
-
72
-
73
-
74
-
75
-
76
-
77
-
78
-
79
-
80
-
81
-
82
-
83
-
84
-
85
-
86
-
87
-
88
-
89
-
90
-
91
-
92
-
93
-
94
-
95
-
96
-
97
-
98
-
99
-
100
-
101
-
102
-
103
-
104
-
105
-
106
-
107
-
108
 |
 |

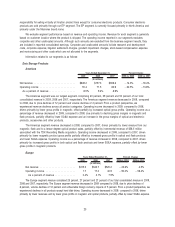
The Europe segment revenue increased in 2008, compared to 2007, driven by incremental revenue of $130.3 million
from the TDK Recording Media acquisition, mostly in optical products, offset partially by declines in magnetic and flash
products revenue. The decrease in our Europe segment 2008 operating income as a percentage of revenue, compared to
2007, was driven by higher SG&A expense as well as lower gross profits in our magnetic products.
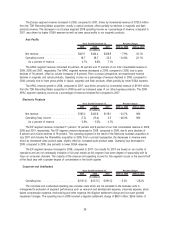
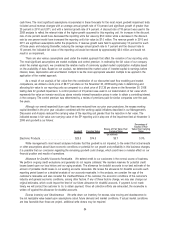
Asia Pacific
2009 2008 2007 2009 vs. 2008 2008 vs. 2007
Years Ended December 31, Percent Change
(In millions)
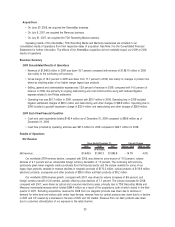
Net revenue . . . . . . . . . . . . . . . . . . . . . . . . $400.1 $434.4 $328.9 ⫺7.9% 32.1%
Operating income . . . . . . . . . . . . . . . . . . . . 18.7 28.7 23.5 ⫺34.8% 22.1%
As a percent of revenue. . . . . . . . . . . . . . 4.7% 6.6% 7.1%
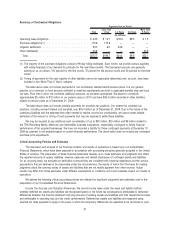
The APAC segment revenue comprised 24 percent, 22 percent and 17 percent of our total consolidated revenue in
2009, 2008 and 2007, respectively. The APAC segment revenue decreased in 2009, compared to 2008, due to price
declines of 16 percent, offset by volume increases of 8 percent. From a product perspective, we experienced revenue
declines in magnetic and optical products. Operating income as a percentage of revenue declined in 2009, compared to
2008, primarily due to lower gross profits in optical, magnetic and flash products, offset partially by lower SG&A expense.
The APAC revenue growth in 2008, compared to 2007, was driven primarily by incremental revenue of $119.9 million
from the TDK Recording Media acquisition in 2008 as well as increased sales of our other business products. The 2008
APAC segment operating income as a percentage of revenue remained flat compared to 2007.
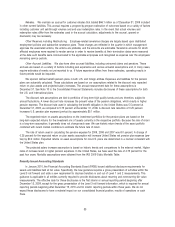
Electronic Products
2009 2008 2007 2009 vs. 2008 2008 vs. 2007
Years Ended December 31, Percent Change
(In millions)
Net revenue . . . . . . . . . . . . . . . . . . . . . . . . $185.0 $245.6 $118.1 ⫺24.7% NM
Operating (loss) income . . . . . . . . . . . . . . . . (7.2) (13.4) 5.5 ⫺46.3% NM
As a percent of revenue. . . . . . . . . . . . . . ⫺3.9% ⫺5.5% 4.7%
The EP segment revenue comprised 11 percent, 12 percent and 6 percent of our total consolidated revenue in 2009,
2008 and 2007, respectively. The EP segment revenue decreased in 2009, compared to 2008, due to price declines of
6 percent and volume declines of 19 percent. This operating segment is the result of the Memcorp business acquisition in
July 2007 and includes the XtremeMac acquisition in 2008. From a product perspective, the decreases in revenue were
driven by decreased video product sales, slightly offset by increased audio product sales. Operating loss decreased in
2009, compared to 2008, due primarily to lower SG&A expense.
The EP segment revenue increased in 2008, compared to 2007. Our results for 2007 are based on six months of
operations and are not necessarily indicative of full year results as this segment has some degree of seasonality with its
focus on consumer channels. The majority of the revenue and operating income for this segment occurs in the second half
of the fiscal year with a greater degree of concentration in the fourth quarter.
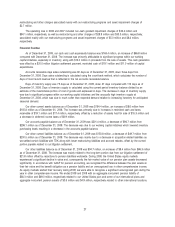
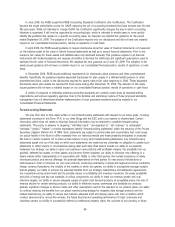
Corporate and Unallocated
2009 2008 2007 2009 vs. 2008 2008 vs. 2007
Years Ended December 31, Percent Change
(In millions)
Operating loss . . . . . . . . . . . . . . . . . . . . . . $(130.3) $(137.5) $(191.5) ⫺5.2% ⫺28.2%
The corporate and unallocated operating loss includes costs which are not allocated to the business units in
management’s evaluation of segment performance such as research and development expense, corporate expense, stock-
based compensation expense, restructuring and other expense, the litigation settlement charge and non-cash goodwill
impairment charges. The operating loss in 2009 included a litigation settlement charge of $49.0 million, $26.6 million of
26