Memorex 2009 Annual Report Download - page 32
Download and view the complete annual report
Please find page 32 of the 2009 Memorex annual report below. You can navigate through the pages in the report by either clicking on the pages listed below, or by using the keyword search tool below to find specific information within the annual report.-
 1
1 -
2
-
3
-
4
-
5
-
6
-
7
-
8
-
9
-
10
-
11
-
12
-
13
-
14
-
15
-
16
-
17
-
18
-
19
-
20
-
21
-
 22
22 -
 23
23 -
 24
24 -
 25
25 -
 26
26 -
 27
27 -
 28
28 -
 29
29 -
 30
30 -
 31
31 -
 32
32 -
 33
33 -
 34
34 -
 35
35 -
 36
36 -
 37
37 -
 38
38 -
 39
39 -
 40
40 -
 41
41 -
 42
42 -
43
-
44
-
45
-
46
-
47
-
48
-
49
-
50
-
51
-
52
-
53
-
54
-
55
-
56
-
57
-
58
-
59
-
60
-
61
-
62
-
63
-
64
-
65
-
66
-
67
-
68
-
69
-
70
-
71
-
72
-
73
-
74
-
75
-
76
-
77
-
78
-
79
-
80
-
81
-
82
-
83
-
84
-
85
-
86
-
87
-
88
-
89
-
90
-
91
-
92
-
93
-
94
-
95
-
96
-
97
-
98
-
99
-
100
-
101
-
102
-
103
-
104
-
105
-
106
-
107
-
108
 |
 |

responsibility for selling virtually all Imation product lines except for consumer electronic products. Consumer electronic
products are sold primarily through our EP segment. The EP segment is currently focused primarily in North America and
primarily under the Memorex brand name.
We evaluate segment performance based on revenue and operating income. Revenue for each segment is generally
based on customer location where the product is shipped. The operating income reported in our segments excludes
corporate and other unallocated amounts. Although such amounts are excluded from the business segment results, they
are included in reported consolidated earnings. Corporate and unallocated amounts include research and development
costs, corporate expense, litigation settlement charges, goodwill impairment charges, stock-based compensation expense
and restructuring and other costs which are not allocated to the segments.
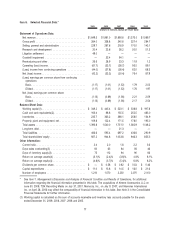
Information related to our segments is as follows:
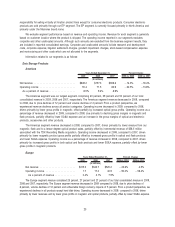
Data Storage Products
Americas
2009 2008 2007 2009 vs. 2008 2008 vs. 2007
Years Ended December 31, Percent Change
(In millions)
Net revenue . . . . . . . . . . . . . . . . . . . . . . . . . . . . $649.2 $757.3 $928.6 ⫺14.3% ⫺18.4%
Operating income . . . . . . . . . . . . . . . . . . . . . . . . 55.4 71.5 82.9 ⫺22.5% ⫺13.8%
As a percent of revenue . . . . . . . . . . . . . . . . . . 8.5% 9.4% 8.9%
The Americas segment was our largest segment comprising 40 percent, 39 percent and 50 percent of our total
consolidated revenue in 2009, 2008 and 2007, respectively. The Americas segment revenue decreased in 2009, compared
to 2008, due to price declines of 12 percent and volume declines of 2 percent. From a product perspective, we
experienced revenue declines across all product categories. Operating income decreased in 2009, compared to 2008,
driven primarily by lower gross profits in magnetic, offset partially by increased optical gross profits. Operating income as a
percentage of revenue decreased in 2009, compared to 2008, due primarily to declining gross margins in magnetic and
flash products, partially offset by lower SG&A expense and an increase in the gross margins of optical and electronic
products, accessories and other products.
The Americas segment revenue decreased in 2008, compared to 2007, driven primarily by lower revenue from our
magnetic, flash and to a lesser degree optical product sales, partially offset by incremental revenue of $58.5 million
associated with the TDK Recording Media acquisition. Operating income decreased in 2008, compared to 2007, driven
primarily by lower magnetic product gross profits partially offset by increased gross profits in optical and flash products
and lower SG&A expense. Operating income as a percentage of revenue increased in 2008, compared to 2007, driven
primarily by increased gross profits in both optical and flash products and lower SG&A expense, partially offset by lower
gross profits in magnetic products.
Europe
2009 2008 2007 2009 vs. 2008 2008 vs. 2007
Years Ended December 31, Percent Change
(In millions)
Net revenue . . . . . . . . . . . . . . . . . . . . . . . . $415.2 $543.7 $520.2 ⫺23.6% 4.5%
Operating income. . . . . . . . . . . . . . . . . . . . . 1.7 17.0 40.9 ⫺90.0% ⫺58.4%
As a percent of revenue . . . . . . . . . . . . . . 0.4% 3.1% 7.9%
The Europe segment revenue comprised 25 percent, 27 percent and 27 percent of our total consolidated revenue in 2009,
2008 and 2007, respectively. The Europe segment revenue decreased in 2009 compared to 2008, due to price declines of
6 percent, volume declines of 12 percent and unfavorable foreign currency impacts of 5 percent. From a product perspective, we
experienced declines in all products except hard disk drives. Operating income decreased in 2009, compared to 2008, driven
primarily by lower revenues and by lower gross profits in magnetic and optical products, partially offset by lower SG&A expense.
25