Memorex 2009 Annual Report Download - page 80
Download and view the complete annual report
Please find page 80 of the 2009 Memorex annual report below. You can navigate through the pages in the report by either clicking on the pages listed below, or by using the keyword search tool below to find specific information within the annual report.-
 1
1 -
2
-
3
-
4
-
5
-
6
-
7
-
8
-
9
-
10
-
11
-
12
-
13
-
14
-
15
-
16
-
17
-
18
-
19
-
20
-
21
-
22
-
23
-
24
-
25
-
26
-
27
-
28
-
29
-
30
-
31
-
32
-
33
-
34
-
35
-
36
-
37
-
38
-
39
-
40
-
41
-
42
-
43
-
44
-
45
-
46
-
47
-
48
-
49
-
50
-
51
-
52
-
53
-
54
-
55
-
56
-
57
-
58
-
59
-
60
-
61
-
62
-
63
-
64
-
65
-
66
-
67
-
68
-
69
-
 70
70 -
 71
71 -
 72
72 -
 73
73 -
 74
74 -
 75
75 -
 76
76 -
 77
77 -
 78
78 -
 79
79 -
 80
80 -
 81
81 -
 82
82 -
 83
83 -
 84
84 -
 85
85 -
 86
86 -
 87
87 -
 88
88 -
 89
89 -
 90
90 -
91
-
92
-
93
-
94
-
95
-
96
-
97
-
98
-
99
-
100
-
101
-
102
-
103
-
104
-
105
-
106
-
107
-
108
 |
 |

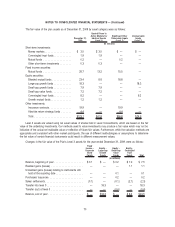
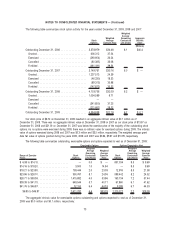
The following table summarizes stock option activity for the years ended December 31, 2009, 2008 and 2007:
Stock
Options
Weighted
Average
Exercise Price
Weighted
Average
Remaining
Contractual
Life (Years)
Aggregate
Intrinsic
Value
(Millions)
Outstanding December 31, 2006 . . . . . . . . . . . . . . . . . 3,378,979 $34.48 6.1 $40.4
Granted. . . . . . . . . . . . . . . . . . . . . . . . . . . . . . . . . 606,312 37.54
Exercised . . . . . . . . . . . . . . . . . . . . . . . . . . . . . . . (293,954) 26.24
Cancelled . . . . . . . . . . . . . . . . . . . . . . . . . . . . . . . (80,385) 33.08
Forfeited . . . . . . . . . . . . . . . . . . . . . . . . . . . . . . . . (461,191) 39.34
Outstanding December 31, 2007 . . . . . . . . . . . . . . . . . 3,149,761 $35.16 6.0 $ —
Granted. . . . . . . . . . . . . . . . . . . . . . . . . . . . . . . . . 1,237,513 24.39
Exercised . . . . . . . . . . . . . . . . . . . . . . . . . . . . . . . (46,330) 18.33
Cancelled . . . . . . . . . . . . . . . . . . . . . . . . . . . . . . . (89,315) 35.98
Forfeited . . . . . . . . . . . . . . . . . . . . . . . . . . . . . . . . (147,873) 35.32
Outstanding December 31, 2008 . . . . . . . . . . . . . . . . . 4,103,756 $32.09 6.2 $ —
Granted. . . . . . . . . . . . . . . . . . . . . . . . . . . . . . . . . 1,054,599 9.71
Exercised . . . . . . . . . . . . . . . . . . . . . . . . . . . . . . . — —
Cancelled . . . . . . . . . . . . . . . . . . . . . . . . . . . . . . . (341,850) 31.25
Forfeited . . . . . . . . . . . . . . . . . . . . . . . . . . . . . . . . (221,667) 28.32
Outstanding December 31, 2009 . . . . . . . . . . . . . . . . . 4,594,838 $27.19 6.2 $ 0.1
Our stock price of $8.72 on December 31, 2009 resulted in an aggregate intrinsic value of $0.1 million as of
December 31, 2009. There was no aggregate intrinsic value at December 31, 2008 or 2007 as our stock price of $13.57 on
December 31, 2008 and $21.00 on December 31, 2007 was below the exercise price of the majority of the outstanding stock
options. As no options were exercised during 2009, there was no intrinsic value for exercised options during 2009. The intrinsic
value of options exercised during 2008 and 2007 was $0.3 million and $3.5 million, respectively. The weighted average grant
date fair value of options granted during the years 2009, 2008 and 2007 was $3.94, $5.97 and $10.95, respectively.
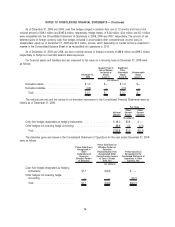
The following table summarizes outstanding, exercisable options and options expected to vest as of December 31, 2009:
Range of Exercise
Prices
Stock
Options
Weighted
Average
Remaining
Contractual
Life (Years)
Weighted
Average
Exercise
Price
Stock
Options
Weighted
Average
Remaining
Contractual
Life (Years)
Weighted
Average
Exercise
Price
Exercisable Options Options Expected to Vest
$ 6.95 to $14.15 . . . . . . . . . . . . . . . . . . . . — 0.0 $ — 857,034 9.3 $ 9.69
$14.16 to $19.20 . . . . . . . . . . . . . . . . . . . . 3,500 1.0 14.94 — 9.3 9.69
$19.21 to $23.95 . . . . . . . . . . . . . . . . . . . . 159,444 2.0 23.09 12,918 8.5 21.58
$23.96 to $28.70 . . . . . . . . . . . . . . . . . . . . 350,767 8.1 24.36 599,442 8.2 24.52
$28.71 to $39.38 . . . . . . . . . . . . . . . . . . . . 1,415,892 4.0 33.96 163,734 7.2 37.44
$39.39 to $41.75 . . . . . . . . . . . . . . . . . . . . 649,544 3.7 40.71 67,860 6.1 41.62
$41.76 to $46.97 . . . . . . . . . . . . . . . . . . . . 32,150 6.4 44.33 9,289 6.7 44.53
$6.95 to $46.97 . . . . . . . . . . . . . . . . . . . 2,611,297 4.4 $33.79 1,710,277 7.2 $19.09
The aggregate intrinsic value for exercisable options outstanding and options expected to vest as of December 31,
2009 was $0.0 million and $0.1 million, respectively.
73
NOTES TO CONSOLIDATED FINANCIAL STATEMENTS — (Continued)