Memorex 2009 Annual Report Download - page 34
Download and view the complete annual report
Please find page 34 of the 2009 Memorex annual report below. You can navigate through the pages in the report by either clicking on the pages listed below, or by using the keyword search tool below to find specific information within the annual report.-
 1
1 -
2
-
3
-
4
-
5
-
6
-
7
-
8
-
9
-
10
-
11
-
12
-
13
-
14
-
15
-
16
-
17
-
18
-
19
-
20
-
21
-
22
-
23
-
 24
24 -
 25
25 -
 26
26 -
 27
27 -
 28
28 -
 29
29 -
 30
30 -
 31
31 -
 32
32 -
 33
33 -
 34
34 -
 35
35 -
 36
36 -
 37
37 -
 38
38 -
 39
39 -
 40
40 -
 41
41 -
 42
42 -
 43
43 -
 44
44 -
45
-
46
-
47
-
48
-
49
-
50
-
51
-
52
-
53
-
54
-
55
-
56
-
57
-
58
-
59
-
60
-
61
-
62
-
63
-
64
-
65
-
66
-
67
-
68
-
69
-
70
-
71
-
72
-
73
-
74
-
75
-
76
-
77
-
78
-
79
-
80
-
81
-
82
-
83
-
84
-
85
-
86
-
87
-
88
-
89
-
90
-
91
-
92
-
93
-
94
-
95
-
96
-
97
-
98
-
99
-
100
-
101
-
102
-
103
-
104
-
105
-
106
-
107
-
108
 |
 |
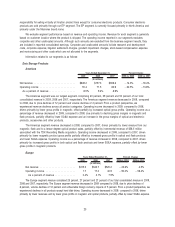
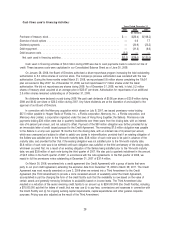
restructuring and other charges associated mainly with our restructuring programs and asset impairment charges of
$2.7 million.
The operating loss in 2008 and 2007 included non-cash goodwill impairment charges of $32.4 million and
$94.1 million, respectively, as well as restructuring and other charges of $28.9 million and $33.3 million, respectively,
associated mainly with our restructuring programs and asset impairment charges of $5.0 million and $8.4 million,
respectively.
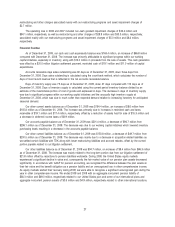
Financial Position
As of December 31, 2009, our cash and cash equivalents balance was $163.4 million, an increase of $66.8 million
compared with December 31, 2008. The increase was primarily attributable to significant progress within our working
capital initiatives, especially in inventory, along with $13.0 million in proceeds from the sale of assets. This cash generation
was offset by a $20.0 million litigation settlement payment, restricted cash of $19.1 million and $11.0 million of capital
expenditures.
Accounts receivable days sales outstanding was 60 days as of December 31, 2009, down three days from
December 31, 2008. Days sales outstanding is calculated using the count-back method, which calculates the number of
days of most recent revenue that is reflected in the net accounts receivable balance.
Days of inventory supply was 75 days as of December 31, 2009, down 37 days compared with 112 days as of
December 31, 2008. Days of inventory supply is calculated using the current period inventory balance divided by an
estimate of the inventoriable portion of cost of goods sold expressed in days. The decrease in days of inventory supply
was due to significant progress within our working capital initiatives and the unusually high inventory supply at
December 31, 2008, which was due to much softer than expected demand relative to increasing inventory for anticipated
seasonal demand.
Our other current assets balance as of December 31, 2009 was $164.4 million, an increase of $8.6 million from
$155.8 million as of December 31, 2008. The increase was primarily due to increases in restricted cash and taxes
receivable of $19.1 million and $17.4 million, respectively, offset by a reduction of assets held for sale of $15.3 million and
a decrease in deferred income taxes of $8.9 million.
Our accounts payable balance as of December 31, 2009 was $201.4 million, a decrease of $94.7 million from
$296.1 million as of December 31, 2008. The decrease was due to our working capital initiatives which lowered inventory
purchasing levels resulting in a decrease in the accounts payable balance.
Our other current liabilities balance as of December 31, 2009 was $150.8 million, a decrease of $49.7 million from
$200.5 million as of December 31, 2008. The decrease was mainly due to a decrease in acquisition related liabilities as
we settled certain liabilities with TDK along with lower restructuring liabilities and accrued rebates, offset by the current
portion payable related to our litigation settlement.
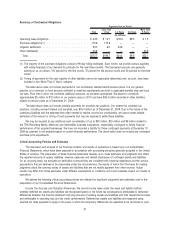
Our other liabilities balance as of December 31, 2009 was $94.7 million, an increase of $8.4 million from $86.3 million
as of December 31, 2008. The increase was mainly related to the long-term portion due from our litigation settlement of
$21.8 million offset by reductions to pension liabilities worldwide. During 2008, the United States equity markets
experienced a significant decline in value and, consequently, the fair market value of our pension plan assets decreased
significantly. In accordance with GAAP for pension accounting, we recognized the difference between the plan assets at
their fair value and the benefit obligation as a pension liability and an unrecognized loss in other comprehensive income.
As equity markets started their recovery during 2009, we were able to recognize a significant unrecognized gain during the
year in other comprehensive income. We ended 2009 and 2008 with an aggregate noncurrent pension liability of
$36.3 million and $49.0 million, respectively related to our United States plan and some of our international plans and
aggregate noncurrent pension assets of $3.5 million and $4.9 million, respectively related to other international locations.
27