Memorex 2009 Annual Report Download - page 77
Download and view the complete annual report
Please find page 77 of the 2009 Memorex annual report below. You can navigate through the pages in the report by either clicking on the pages listed below, or by using the keyword search tool below to find specific information within the annual report.-
 1
1 -
2
-
3
-
4
-
5
-
6
-
7
-
8
-
9
-
10
-
11
-
12
-
13
-
14
-
15
-
16
-
17
-
18
-
19
-
20
-
21
-
22
-
23
-
24
-
25
-
26
-
27
-
28
-
29
-
30
-
31
-
32
-
33
-
34
-
35
-
36
-
37
-
38
-
39
-
40
-
41
-
42
-
43
-
44
-
45
-
46
-
47
-
48
-
49
-
50
-
51
-
52
-
53
-
54
-
55
-
56
-
57
-
58
-
59
-
60
-
61
-
62
-
63
-
64
-
65
-
66
-
 67
67 -
 68
68 -
 69
69 -
 70
70 -
 71
71 -
 72
72 -
 73
73 -
 74
74 -
 75
75 -
 76
76 -
 77
77 -
 78
78 -
 79
79 -
 80
80 -
 81
81 -
 82
82 -
 83
83 -
 84
84 -
 85
85 -
 86
86 -
 87
87 -
88
-
89
-
90
-
91
-
92
-
93
-
94
-
95
-
96
-
97
-
98
-
99
-
100
-
101
-
102
-
103
-
104
-
105
-
106
-
107
-
108
 |
 |

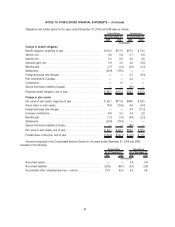
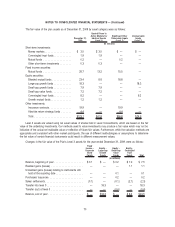
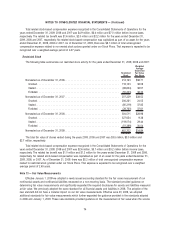
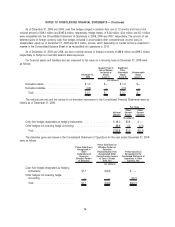
The fair value of the plan assets as of December 31, 2009 by asset category were as follows:
December 31,
2009
Quoted Prices in
Active Markets for
Identical Assets
(Level 1)
Significant Other
Observable Inputs
(Level 2)
Unobservable
Inputs
(Level 3)
(In millions)
Short-term investments:
Money markets. . . . . . . . . . . . . . . . . . $ 3.5 $ 3.5 $ — $ —
Commingled trust funds . . . . . . . . . . . . 1.9 1.9 — —
Mutual funds . . . . . . . . . . . . . . . . . . . 0.2 — 0.2 —
Other short-term investments . . . . . . . . 0.3 0.3 — —
Fixed income securities:
Mutual funds . . . . . . . . . . . . . . . . . . . 28.7 13.2 15.5 —
Equity securities:
Blended mutual funds . . . . . . . . . . . . . 23.4 6.6 16.8 —
Large-cap growth funds . . . . . . . . . . . . 18.3 — — 18.3
Small-cap growth funds . . . . . . . . . . . . 7.9 7.9 — —
Small-cap value funds . . . . . . . . . . . . . 7.2 7.2 — —
Commingled trust funds . . . . . . . . . . . . 6.2 — — 6.2
Growth mutual funds . . . . . . . . . . . . . . 1.2 1.2 — —
Other investments:
Insurance contracts . . . . . . . . . . . . . . . 19.9 — 19.9 —
Absolute return strategy funds . . . . . . . 4.4 — 4.4 —
Total . . . . . . . . . . . . . . . . . . . . . . . . . $123.1 $41.8 $56.8 $24.5
Level 3 assets are valued using net asset values of shares held in Level 3 investments, which are based on the fair
value of the underlying investments. Our methods used to value investments may produce a fair value which may not be
indicative of the actual net realizable value or reflective of future fair values. Furthermore, while the valuation methods are
appropriate and consistent with other market participants, the use of different methodologies or assumptions to determine
the fair value of certain financial instruments could result in different measurement values.
Changes in the fair value of the Plan’s Level 3 assets for the year ended December 31, 2009, were as follows:
Fixed
Income -
Corporate
Bond
Funds
Equity -
Large-cap
Growth
Funds
Equity -
Small-cap
Value
Funds
Equity -
Comingled
Trust
Funds Total
(In millions)
Balance, beginning of year . . . . . . . . . . . . . . . . . . . $ 0.1 $ — $ 0.2 $ 7.2 $ 7.5
Realized gains (losses) . . . . . . . . . . . . . . . . . . . . . — — — 1.1 1.1
Unrealized gains (losses) relating to instruments still
held at the reporting date . . . . . . . . . . . . . . . . . . — — 0.1 — 0.1
Purchases/ issuances . . . . . . . . . . . . . . . . . . . . . . — — 0.2 — 0.2
Sales/ settlements . . . . . . . . . . . . . . . . . . . . . . . . . (0.1) — (0.1) (2.1) (2.3)
Transfer into level 3 . . . . . . . . . . . . . . . . . . . . . . . . — 18.3 — — 18.3
Transfer (out) of level 3 . . . . . . . . . . . . . . . . . . . . . — — (0.4) — (0.4)
Balance, end of year . . . . . . . . . . . . . . . . . . . . . . . $ — $18.3 $ — $ 6.2 $24.5
70
NOTES TO CONSOLIDATED FINANCIAL STATEMENTS — (Continued)