Memorex 2009 Annual Report Download - page 27
Download and view the complete annual report
Please find page 27 of the 2009 Memorex annual report below. You can navigate through the pages in the report by either clicking on the pages listed below, or by using the keyword search tool below to find specific information within the annual report.-
 1
1 -
2
-
3
-
4
-
5
-
6
-
7
-
8
-
9
-
10
-
11
-
12
-
13
-
14
-
15
-
16
-
 17
17 -
 18
18 -
 19
19 -
 20
20 -
 21
21 -
 22
22 -
 23
23 -
 24
24 -
 25
25 -
 26
26 -
 27
27 -
 28
28 -
 29
29 -
 30
30 -
 31
31 -
 32
32 -
 33
33 -
 34
34 -
 35
35 -
 36
36 -
 37
37 -
38
-
39
-
40
-
41
-
42
-
43
-
44
-
45
-
46
-
47
-
48
-
49
-
50
-
51
-
52
-
53
-
54
-
55
-
56
-
57
-
58
-
59
-
60
-
61
-
62
-
63
-
64
-
65
-
66
-
67
-
68
-
69
-
70
-
71
-
72
-
73
-
74
-
75
-
76
-
77
-
78
-
79
-
80
-
81
-
82
-
83
-
84
-
85
-
86
-
87
-
88
-
89
-
90
-
91
-
92
-
93
-
94
-
95
-
96
-
97
-
98
-
99
-
100
-
101
-
102
-
103
-
104
-
105
-
106
-
107
-
108
 |
 |

Acquisitions
•On June 30, 2008, we acquired the XtremeMac business.
•On July 9, 2007, we acquired the Memcorp business.
•On July 31, 2007, we acquired the TDK Recording Media business.
Operating results of the XtremeMac, TDK Recording Media and Memcorp businesses are included in our
consolidated results of operations from their respective dates of acquisition. See Note 3 to the Consolidated Financial
Statements for further information. The effects of the XtremeMac acquisition did not materially impact our 2009 or 2008
results of operations.
Executive Summary
2009 Consolidated Results of Operations
•Revenue of $1,649.5 million in 2009 was down 16.7 percent compared with revenue of $1,981.0 million in 2008
due mainly to the continuing soft economy.
•Gross margin of 16.0 percent in 2009 was down from 17.1 percent in 2008, due mainly to changes in product mix
driven by declining sales of our higher margin legacy tape products.
•Selling, general and administrative expense was 13.9 percent of revenue in 2009, compared with 14.5 percent of
revenue in 2008, due primarily to ongoing restructuring and cost control actions along with reduced litigation
expense related to the Philips settlement.
•Operating loss was $61.7 million in 2009, compared with $33.7 million in 2008. Operating loss in 2009 included
litigation settlement charges of $49.0 million and restructuring and other charges of $26.6 million. Operating loss in
2008 included a goodwill impairment charge of $32.4 million and restructuring and other charges of $28.9 million.
2009 Cash Flow/Financial Condition
•Cash and cash equivalents totaled $163.4 million as of December 31, 2009 compared to $96.6 million as of
December 31, 2008.
•Cash flow provided by operating activities was $67.5 million for 2009 compared to $84.7 million for 2008.
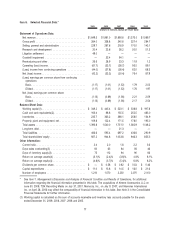
Results of Operations
Net Revenue
2009 2008 2007 2009 vs. 2008 2008 vs. 2007
Years Ended December 31, Percent Change
(In millions)
Net revenue. . . . . . . . . . . . . . . . . . . . . . . . . . . . . . . $1,649.5 $1,981.0 $1,895.8 ⫺16.7% 4.5%
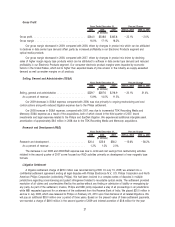
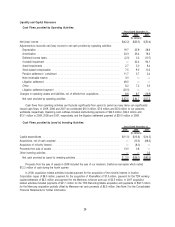
Our worldwide 2009 revenue decline, compared with 2008, was driven by price erosion of 10.5 percent, volume
declines of 4.7 percent and an unfavorable foreign currency translation of 1.5 percent. The continuing soft economy,
particularly given lower magnetic media purchases from the financial sector and the mature markets for some of our
legacy tape products, resulted in revenue declines in magnetic products of $170.2 million, optical products of $113.6 million,
electronic products, accessories and other products of $38.5 million and flash products of $9.2 million.
Our worldwide 2008 revenue growth, compared with 2007, was driven by volume increases of 8.8 percent, and
foreign currency benefit of 2.8 percent, partially offset by price declines of 7.1 percent. The volume increases for 2008,
compared with 2007, were driven by optical and consumer electronics sales, primarily due to TDK Recording Media and
Memcorp incremental revenue which totaled $394.4 million as a result of the acquisitions, both of which closed in the third
quarter of 2007. Excluding acquisitions, revenue for 2008 from our magnetic products was down due to declines in
demand for entry level and mature data center tape formats; revenue from our optical products was down due to a decline
in DVD and CD caused by a decrease in the size of DVD and CD market. Revenue from our flash products was down
due to a planned rationalization of our exposure in the retail channel.
20