Memorex 2009 Annual Report Download - page 24
Download and view the complete annual report
Please find page 24 of the 2009 Memorex annual report below. You can navigate through the pages in the report by either clicking on the pages listed below, or by using the keyword search tool below to find specific information within the annual report.-
 1
1 -
2
-
3
-
4
-
5
-
6
-
7
-
8
-
9
-
10
-
11
-
12
-
13
-
 14
14 -
 15
15 -
 16
16 -
 17
17 -
 18
18 -
 19
19 -
 20
20 -
 21
21 -
 22
22 -
 23
23 -
 24
24 -
 25
25 -
 26
26 -
 27
27 -
 28
28 -
 29
29 -
 30
30 -
 31
31 -
 32
32 -
 33
33 -
 34
34 -
35
-
36
-
37
-
38
-
39
-
40
-
41
-
42
-
43
-
44
-
45
-
46
-
47
-
48
-
49
-
50
-
51
-
52
-
53
-
54
-
55
-
56
-
57
-
58
-
59
-
60
-
61
-
62
-
63
-
64
-
65
-
66
-
67
-
68
-
69
-
70
-
71
-
72
-
73
-
74
-
75
-
76
-
77
-
78
-
79
-
80
-
81
-
82
-
83
-
84
-
85
-
86
-
87
-
88
-
89
-
90
-
91
-
92
-
93
-
94
-
95
-
96
-
97
-
98
-
99
-
100
-
101
-
102
-
103
-
104
-
105
-
106
-
107
-
108
 |
 |

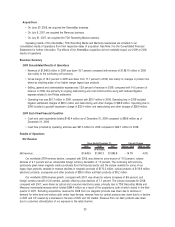
Item 6. Selected Financial Data.*
2009 2008 2007 2006 2005
(Dollars in millions, except per share data)
Statement of Operations Data:
Net revenue . . . . . . . . . . . . . . . . . . . . . . . . . . . . . . . . . $1,649.5 $1,981.0 $1,895.8 $1,373.0 $1,089.7
Gross profit . . . . . . . . . . . . . . . . . . . . . . . . . . . . . . . . . 264.0 338.8 345.8 327.4 284.7
Selling, general and administrative . . . . . . . . . . . . . . . . . 229.7 287.6 218.9 170.0 143.1
Research and development . . . . . . . . . . . . . . . . . . . . . . 20.4 23.6 38.2 50.0 51.3
Litigation settlement . . . . . . . . . . . . . . . . . . . . . . . . . . . 49.0 — — — —
Goodwill impairment . . . . . . . . . . . . . . . . . . . . . . . . . . . — 32.4 94.1 — —
Restructuring and other . . . . . . . . . . . . . . . . . . . . . . . . . 26.6 28.9 33.3 11.9 1.2
Operating (loss) income . . . . . . . . . . . . . . . . . . . . . . . . . (61.7) (33.7) (38.7) 95.5 89.1
(Loss) income from continuing operations . . . . . . . . . . . . (44.0) (37.8) (56.4) 62.0 68.3
Net (loss) income . . . . . . . . . . . . . . . . . . . . . . . . . . . . . (42.2) (33.3) (50.4) 76.4 87.9
(Loss) earnings per common share from continuing
operations:
Basic. . . . . . . . . . . . . . . . . . . . . . . . . . . . . . . . . . . . (1.17) (1.01) (1.52) 1.79 2.02
Diluted. . . . . . . . . . . . . . . . . . . . . . . . . . . . . . . . . . . (1.17) (1.01) (1.52) 1.76 1.97
Net (loss) earnings per common share:
Basic. . . . . . . . . . . . . . . . . . . . . . . . . . . . . . . . . . . . (1.13) (0.89) (1.36) 2.21 2.59
Diluted. . . . . . . . . . . . . . . . . . . . . . . . . . . . . . . . . . . (1.13) (0.89) (1.36) 2.17 2.54
Balance Sheet Data:
Working capital(1) . . . . . . . . . . . . . . . . . . . . . . . . . . . . . $ 349.2 $ 445.4 $ 523.1 $ 338.8 $ 197.8
Cash and cash equivalents(2). . . . . . . . . . . . . . . . . . . . . 163.4 96.6 135.5 252.5 483.0
Inventories . . . . . . . . . . . . . . . . . . . . . . . . . . . . . . . . . . 235.7 363.2 366.1 258.0 134.9
Property, plant and equipment, net . . . . . . . . . . . . . . . . . 109.8 122.4 171.5 178.0 195.0
Total assets . . . . . . . . . . . . . . . . . . . . . . . . . . . . . . . . . 1,393.8 1,540.0 1,751.0 1,382.9 1,146.2
Long-term debt . . . . . . . . . . . . . . . . . . . . . . . . . . . . . . . — — 21.3 — —
Total liabilities . . . . . . . . . . . . . . . . . . . . . . . . . . . . . . . . 466.6 595.4 697.2 436.6 290.9
Total shareholders’ equity. . . . . . . . . . . . . . . . . . . . . . . . 927.2 944.6 1,053.8 946.3 855.3
Other Information:
Current ratio. . . . . . . . . . . . . . . . . . . . . . . . . . . . . . . . . 2.4 2.0 1.8 2.2 3.6
Days sales outstanding(3) . . . . . . . . . . . . . . . . . . . . . . . 60 63 64 56 46
Days of inventory supply(3) . . . . . . . . . . . . . . . . . . . . . . 75 112 94 90 66
Return on average assets(4) . . . . . . . . . . . . . . . . . . . . . (3.1)% (2.4)% (3.6)% 4.8% 6.1%
Return on average equity(4) . . . . . . . . . . . . . . . . . . . . . . (4.8)% (3.7)% (5.4)% 6.8% 8.2%
Dividends per common share . . . . . . . . . . . . . . . . . . . . . $ — $ 0.56 $ 0.62 $ 0.54 $ 0.46
Capital expenditures . . . . . . . . . . . . . . . . . . . . . . . . . . . $ 11.0 $ 13.6 $ 14.5 $ 16.0 $ 21.6
Number of employees . . . . . . . . . . . . . . . . . . . . . . . . . . 1,210 1,570 2,250 2,070 2,100
* See Item 7. Management’s Discussion and Analysis of Financial Condition and Results of Operations, for additional
information regarding the financial information presented in this table. The acquisitions of Xtreme Accessories, LLC on
June 30, 2008, TDK Recording Media on July 31, 2007, Memcorp, Inc., on July 9, 2007, and Memorex International
Inc. on April 28, 2006 may affect the comparability of financial information in this table. See Note 3 in the Consolidated
Financial Statements for further information.
(1) Working capital is calculated as the sum of accounts receivable and inventory less accounts payable for the years
ended December 31, 2009, 2008, 2007, 2006 and 2005.
17