Johnson Controls 2015 Annual Report Download - page 98
Download and view the complete annual report
Please find page 98 of the 2015 Johnson Controls annual report below. You can navigate through the pages in the report by either clicking on the pages listed below, or by using the keyword search tool below to find specific information within the annual report.-
 1
1 -
2
-
3
-
4
-
5
-
6
-
7
-
8
-
9
-
10
-
11
-
12
-
13
-
14
-
15
-
16
-
17
-
18
-
19
-
20
-
21
-
22
-
23
-
24
-
25
-
26
-
27
-
28
-
29
-
30
-
31
-
32
-
33
-
34
-
35
-
36
-
37
-
38
-
39
-
40
-
41
-
42
-
43
-
44
-
45
-
46
-
47
-
48
-
49
-
50
-
51
-
52
-
53
-
54
-
55
-
56
-
57
-
58
-
59
-
60
-
61
-
62
-
63
-
64
-
65
-
66
-
67
-
68
-
69
-
70
-
71
-
72
-
73
-
74
-
75
-
76
-
77
-
78
-
79
-
80
-
81
-
82
-
83
-
84
-
85
-
86
-
87
-
 88
88 -
 89
89 -
 90
90 -
 91
91 -
 92
92 -
 93
93 -
 94
94 -
 95
95 -
 96
96 -
 97
97 -
 98
98 -
 99
99 -
 100
100 -
 101
101 -
 102
102 -
 103
103 -
 104
104 -
 105
105 -
 106
106 -
 107
107 -
 108
108 -
109
-
110
-
111
-
112
-
113
-
114
-
115
-
116
-
117
-
118
-
119
-
120
-
121
 |
 |

98
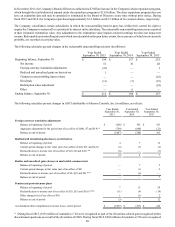
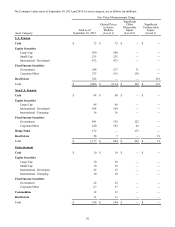
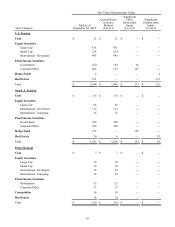
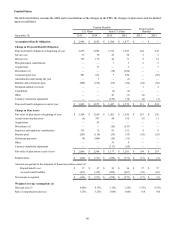
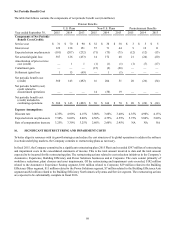
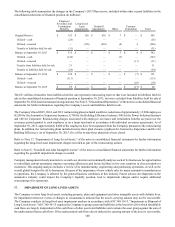
Net Periodic Benefit Cost
The table that follows contains the components of net periodic benefit cost (in millions):
Pension Benefits
Postretirement Benefits U.S. Plans Non-U.S. Plans
Year ended September 30, 2015 2014 2013 2015 2014 2013 2015 2014 2013
Components of Net Periodic
Benefit Cost (Credit):
Service cost $ 31 $ 70 $ 90 $ 32 $ 38 $ 38 $ 3 $ 5 $ 5
Interest cost 122 138 151 57 71 64 9 12 11
Expected return on plan assets (181) (207) (232) (71)(75)(71)(12)(12)(13)
Net actuarial (gain) loss 387 126 (433) 14 172 48 21 (24)(20)
Amortization of prior service
cost (credit) — 1 1 (1)(1)(1)(1)(7)(17)
Curtailment gain — — — (15)(2)(26) — — —
Settlement (gain) loss 1 15 (69) — 1 (1) — — —
Net periodic benefit cost
(credit) 360 143 (492) 16 204 51 20 (26)(34)
Net periodic benefit (cost)
credit related to
discontinued operations — — — 14 (38) 19 — — —
Net periodic benefit cost
(credit) included in
continuing operations $ 360 $ 143 $ (492) $ 30 $ 166 $ 70 $ 20 $ (26) $ (34)
Expense Assumptions:
Discount rate 4.35% 4.90% 4.15% 3.00% 3.60% 3.40% 4.35% 4.90% 4.15%
Expected return on plan assets 7.50% 8.00% 8.00% 4.50% 4.75% 4.55% 5.75% 5.80% 5.80%
Rate of compensation increase 3.25% 3.30% 3.25% 2.60% 2.60% 2.45% NA NA NA
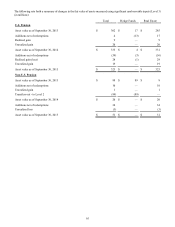
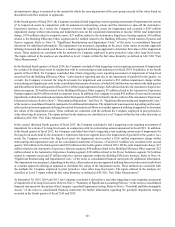
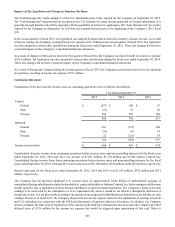
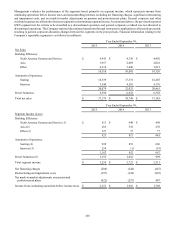
16. SIGNIFICANT RESTRUCTURING AND IMPAIRMENT COSTS
To better align its resources with its growth strategies and reduce the cost structure of its global operations to address the softness
in certain underlying markets, the Company commits to restructuring plans as necessary.
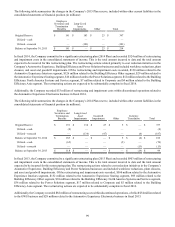
In fiscal 2015, the Company committed to a significant restructuring plan (2015 Plan) and recorded $397 million of restructuring
and impairment costs in the consolidated statements of income. This is the total amount incurred to date and the total amount
expected to be incurred for this restructuring plan. The restructuring actions related to cost reduction initiatives in the Company’s
Automotive Experience, Building Efficiency and Power Solutions businesses and at Corporate. The costs consist primarily of
workforce reductions, plant closures and asset impairments. Of the restructuring and impairment costs recorded, $182 million
related to the Automotive Experience Seating segment, $166 million related to Corporate, $29 million related to the Building
Efficiency Other segment, $11 million related to the Power Solutions segment, $7 million related to the Building Efficiency Asia
segment and $2 million related to the Building Efficiency North America Systems and Service segment. The restructuring actions
are expected to be substantially complete in fiscal 2016.