Johnson Controls 2015 Annual Report Download - page 109
Download and view the complete annual report
Please find page 109 of the 2015 Johnson Controls annual report below. You can navigate through the pages in the report by either clicking on the pages listed below, or by using the keyword search tool below to find specific information within the annual report.-
 1
1 -
2
-
3
-
4
-
5
-
6
-
7
-
8
-
9
-
10
-
11
-
12
-
13
-
14
-
15
-
16
-
17
-
18
-
19
-
20
-
21
-
22
-
23
-
24
-
25
-
26
-
27
-
28
-
29
-
30
-
31
-
32
-
33
-
34
-
35
-
36
-
37
-
38
-
39
-
40
-
41
-
42
-
43
-
44
-
45
-
46
-
47
-
48
-
49
-
50
-
51
-
52
-
53
-
54
-
55
-
56
-
57
-
58
-
59
-
60
-
61
-
62
-
63
-
64
-
65
-
66
-
67
-
68
-
69
-
70
-
71
-
72
-
73
-
74
-
75
-
76
-
77
-
78
-
79
-
80
-
81
-
82
-
83
-
84
-
85
-
86
-
87
-
88
-
89
-
90
-
91
-
92
-
93
-
94
-
95
-
96
-
97
-
98
-
 99
99 -
 100
100 -
 101
101 -
 102
102 -
 103
103 -
 104
104 -
 105
105 -
 106
106 -
 107
107 -
 108
108 -
 109
109 -
 110
110 -
 111
111 -
 112
112 -
 113
113 -
 114
114 -
 115
115 -
 116
116 -
 117
117 -
 118
118 -
 119
119 -
120
-
121
 |
 |

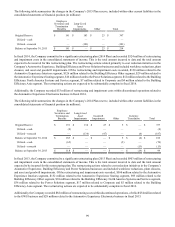
109
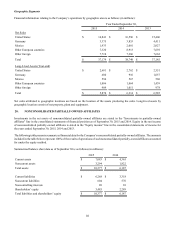
September 30,
2015 2014 2013
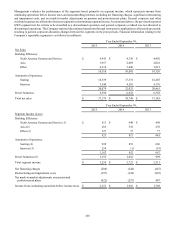
Assets
Building Efficiency
North America Systems and Service $ 2,726 $ 2,758 $ 2,699
Global Workplace Solutions (7) — — 1,286
Asia 1,326 1,341 1,352
Other 5,331 5,459 3,769
9,383 9,558 9,106
Automotive Experience
Seating 8,611 8,969 9,763
Interiors (7) 1,265 321 1,872
9,876 9,290 11,635
Power Solutions 6,590 6,888 7,459
Assets held for sale 55 2,787 804
Unallocated 3,769 4,281 2,514
Total $ 29,673 $ 32,804 $ 31,518
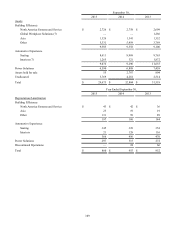
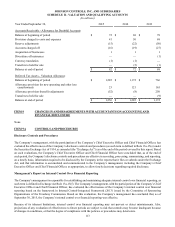
Year Ended September 30,
2015 2014 2013
Depreciation/Amortization
Building Efficiency
North America Systems and Service $ 43 $ 42 $ 36
Asia 23 19 19
Other 131 99 89
197 160 144
Automotive Experience
Seating 345 328 354
Interiors 21 128 116
366 456 470
Power Solutions 297 315 272
Discontinued Operations — 24 66
Total $ 860 $ 955 $ 952