Johnson Controls 2015 Annual Report Download - page 33
Download and view the complete annual report
Please find page 33 of the 2015 Johnson Controls annual report below. You can navigate through the pages in the report by either clicking on the pages listed below, or by using the keyword search tool below to find specific information within the annual report.-
 1
1 -
2
-
3
-
4
-
5
-
6
-
7
-
8
-
9
-
10
-
11
-
12
-
13
-
14
-
15
-
16
-
17
-
18
-
19
-
20
-
21
-
22
-
 23
23 -
 24
24 -
 25
25 -
 26
26 -
 27
27 -
 28
28 -
 29
29 -
 30
30 -
 31
31 -
 32
32 -
 33
33 -
 34
34 -
 35
35 -
 36
36 -
 37
37 -
 38
38 -
 39
39 -
 40
40 -
 41
41 -
 42
42 -
 43
43 -
44
-
45
-
46
-
47
-
48
-
49
-
50
-
51
-
52
-
53
-
54
-
55
-
56
-
57
-
58
-
59
-
60
-
61
-
62
-
63
-
64
-
65
-
66
-
67
-
68
-
69
-
70
-
71
-
72
-
73
-
74
-
75
-
76
-
77
-
78
-
79
-
80
-
81
-
82
-
83
-
84
-
85
-
86
-
87
-
88
-
89
-
90
-
91
-
92
-
93
-
94
-
95
-
96
-
97
-
98
-
99
-
100
-
101
-
102
-
103
-
104
-
105
-
106
-
107
-
108
-
109
-
110
-
111
-
112
-
113
-
114
-
115
-
116
-
117
-
118
-
119
-
120
-
121
 |
 |

33
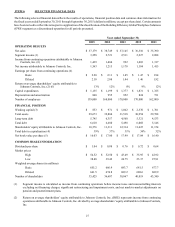
The increase in net income attributable to Johnson Controls, Inc. was primarily due to higher income from continuing and
discontinued operations, partially offset by an increase in the income tax provision. Fiscal 2015 diluted earnings per share attributable
to Johnson Controls, Inc. was $2.36 compared to $1.80 in fiscal 2014.
Segment Analysis
Management evaluates the performance of its business units based primarily on segment income, which is defined as income from
continuing operations before income taxes and noncontrolling interests excluding net financing charges, significant restructuring
and impairment costs, and net mark-to-market adjustments on pension and postretirement plans.
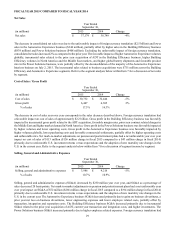
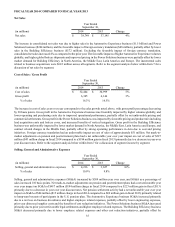
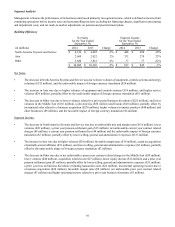
Building Efficiency
Net Sales
for the Year Ended
September 30,
Segment Income
for the Year Ended
September 30,
(in millions) 2015 2014 Change 2015 2014 Change
North America Systems and Service $ 4,443 $ 4,336 2% $ 513 $ 448 15%
Asia 1,957 2,069 -5% 283 332 -15%
Other 4,110 3,680 12% 127 37 *
$ 10,510 $ 10,085 4% $ 923 $ 817 13%
* Measure not meaningful
Net Sales:
• The increase in North America Systems and Service was due to higher volumes of equipment, controls systems and service
($150 million), partially offset by the unfavorable impact of foreign currency translation ($43 million).
• The decrease in Asia was due to the unfavorable impact of foreign currency translation ($107 million), and lower volumes
of equipment and controls systems ($80 million), partially offset by incremental sales due to business acquisitions ($38
million) and higher service volumes ($37 million).
• The increase in Other was due to incremental sales related to the ADT acquisition ($629 million), and higher volumes in
the Middle East ($73 million) and other businesses ($64 million), partially offset by the unfavorable impact of foreign
currency translation ($264 million) and lower volumes in Latin America ($72 million).
Segment Income:
• The increase in North America Systems and Service was due to higher volumes ($39 million), favorable mix and margin
rates ($27 million), net unfavorable prior year contract related charges ($9 million), current year gains on business
divestitures net of higher selling, general and administrative expenses ($4 million), and a prior year pension settlement
loss ($4 million), partially offset by current year transaction and integration costs ($14 million), and the unfavorable
impact of foreign currency translation ($4 million).
• The decrease in Asia was due to higher selling, general and administrative expenses ($36 million), a prior year gain on
acquisition of partially-owned affiliates ($19 million), the unfavorable impact of foreign currency translation ($17 million),
lower volumes ($8 million), and current year transaction and integration costs ($6 million), partially offset by favorable
margin rates ($31 million) and incremental operating income due to business acquisitions ($6 million).
• The increase in Other was due to incremental operating income related to the ADT acquisition ($55 million), net
unfavorable prior year contract related charges in the Middle East ($50 million), prior year acquisition related costs ($27
million), higher equity income ($9 million), higher volumes ($8 million) and favorable margin rates ($6 million), partially
offset by higher selling, general and administrative expenses ($34 million), current year transaction and integration costs
($17 million), and the unfavorable impact of foreign currency translation ($14 million).