Johnson Controls 2015 Annual Report Download - page 43
Download and view the complete annual report
Please find page 43 of the 2015 Johnson Controls annual report below. You can navigate through the pages in the report by either clicking on the pages listed below, or by using the keyword search tool below to find specific information within the annual report.-
 1
1 -
2
-
3
-
4
-
5
-
6
-
7
-
8
-
9
-
10
-
11
-
12
-
13
-
14
-
15
-
16
-
17
-
18
-
19
-
20
-
21
-
22
-
23
-
24
-
25
-
26
-
27
-
28
-
29
-
30
-
31
-
32
-
 33
33 -
 34
34 -
 35
35 -
 36
36 -
 37
37 -
 38
38 -
 39
39 -
 40
40 -
 41
41 -
 42
42 -
 43
43 -
 44
44 -
 45
45 -
 46
46 -
 47
47 -
 48
48 -
 49
49 -
 50
50 -
 51
51 -
 52
52 -
 53
53 -
54
-
55
-
56
-
57
-
58
-
59
-
60
-
61
-
62
-
63
-
64
-
65
-
66
-
67
-
68
-
69
-
70
-
71
-
72
-
73
-
74
-
75
-
76
-
77
-
78
-
79
-
80
-
81
-
82
-
83
-
84
-
85
-
86
-
87
-
88
-
89
-
90
-
91
-
92
-
93
-
94
-
95
-
96
-
97
-
98
-
99
-
100
-
101
-
102
-
103
-
104
-
105
-
106
-
107
-
108
-
109
-
110
-
111
-
112
-
113
-
114
-
115
-
116
-
117
-
118
-
119
-
120
-
121
 |
 |

43
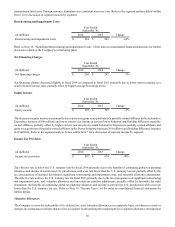
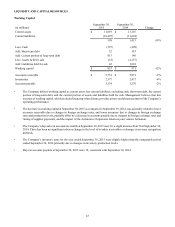
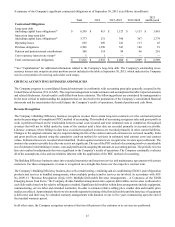
LIQUIDITY AND CAPITAL RESOURCES
Working Capital
September 30,
2015 September 30,
2014(in millions) Change
Current assets $ 11,093 $ 13,107
Current liabilities (10,495)(11,694)
598 1,413 -58%
Less: Cash (597)(409)
Add: Short-term debt 52 183
Add: Current portion of long-term debt 813 140
Less: Assets held for sale (55)(2,157)
Add: Liabilities held for sale 42 1,801
Working capital $ 853 $ 971 -12%
Accounts receivable $ 5,751 $ 5,871 -2%
Inventories 2,377 2,477 -4%
Accounts payable 5,174 5,270 -2%
• The Company defines working capital as current assets less current liabilities, excluding cash, short-term debt, the current
portion of long-term debt, and the current portion of assets and liabilities held for sale. Management believes that this
measure of working capital, which excludes financing-related items, provides a more useful measurement of the Company’s
operating performance.
• The decrease in working capital at September 30, 2015 as compared to September 30, 2014, was primarily related to lower
accounts receivable due to changes in foreign exchange rates, and lower inventory due to changes in foreign exchange
rates and production levels, partially offset by a decrease in accounts payable due to changes in foreign exchange rates and
timing of supplier payments, and the impact of the Automotive Experience Interiors joint venture formation.
• The Company’s days sales in accounts receivable at September 30, 2015 were 56, a slight increase from 54 at September 30,
2014. There has been no significant adverse change in the level of overdue receivables or changes in revenue recognition
methods.
• The Company’s inventory turns for the year ended September 30, 2015 were slightly higher than the comparable period
ended September 30, 2014 primarily due to changes in inventory production levels.
• Days in accounts payable at September 30, 2015 were 74, consistent with September 30, 2014.