Johnson Controls 2015 Annual Report Download - page 81
Download and view the complete annual report
Please find page 81 of the 2015 Johnson Controls annual report below. You can navigate through the pages in the report by either clicking on the pages listed below, or by using the keyword search tool below to find specific information within the annual report.-
 1
1 -
2
-
3
-
4
-
5
-
6
-
7
-
8
-
9
-
10
-
11
-
12
-
13
-
14
-
15
-
16
-
17
-
18
-
19
-
20
-
21
-
22
-
23
-
24
-
25
-
26
-
27
-
28
-
29
-
30
-
31
-
32
-
33
-
34
-
35
-
36
-
37
-
38
-
39
-
40
-
41
-
42
-
43
-
44
-
45
-
46
-
47
-
48
-
49
-
50
-
51
-
52
-
53
-
54
-
55
-
56
-
57
-
58
-
59
-
60
-
61
-
62
-
63
-
64
-
65
-
66
-
67
-
68
-
69
-
70
-
 71
71 -
 72
72 -
 73
73 -
 74
74 -
 75
75 -
 76
76 -
 77
77 -
 78
78 -
 79
79 -
 80
80 -
 81
81 -
 82
82 -
 83
83 -
 84
84 -
 85
85 -
 86
86 -
 87
87 -
 88
88 -
 89
89 -
 90
90 -
 91
91 -
92
-
93
-
94
-
95
-
96
-
97
-
98
-
99
-
100
-
101
-
102
-
103
-
104
-
105
-
106
-
107
-
108
-
109
-
110
-
111
-
112
-
113
-
114
-
115
-
116
-
117
-
118
-
119
-
120
-
121
 |
 |

81
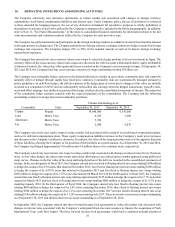
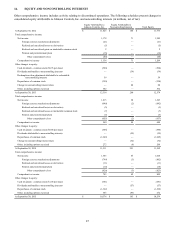
ASC 820 requires the use of observable market data, when available, in making fair value measurements. When inputs used to
measure fair value fall within different levels of the hierarchy, the level within which the fair value measurement is categorized
is based on the lowest level input that is significant to the fair value measurement.
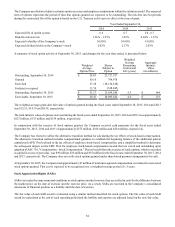
Recurring Fair Value Measurements
The following tables present the Company’s fair value hierarchy for those assets and liabilities measured at fair value as of
September 30, 2015 and 2014 (in millions):
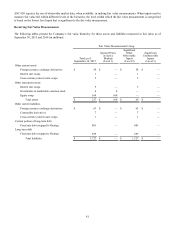
Fair Value Measurements Using:
Total as of
September 30, 2015
Quoted Prices
in Active
Markets
(Level 1)
Significant
Other
Observable
Inputs
(Level 2)
Significant
Unobservable
Inputs
(Level 3)
Other current assets
Foreign currency exchange derivatives $ 58 $ — $ 58 $ —
Interest rate swaps 1 — 1 —
Cross-currency interest rate swaps 5 — 5 —
Other noncurrent assets
Interest rate swaps 5 — 5 —
Investments in marketable common stock 4 4 — —
Equity swap 164 164 — —
Total assets $ 237 $ 168 $ 69 $ —
Other current liabilities
Foreign currency exchange derivatives $ 63 $ — $ 63 $ —
Commodity derivatives 7 — 7 —
Cross-currency interest rate swaps 1 — 1—
Current portion of long-term debt
Fixed rate debt swapped to floating 801 — 801 —
Long-term debt
Fixed rate debt swapped to floating 855 — 855 —
Total liabilities $ 1,727 $ — $ 1,727 $ —