Johnson Controls 2015 Annual Report Download - page 72
Download and view the complete annual report
Please find page 72 of the 2015 Johnson Controls annual report below. You can navigate through the pages in the report by either clicking on the pages listed below, or by using the keyword search tool below to find specific information within the annual report.-
 1
1 -
2
-
3
-
4
-
5
-
6
-
7
-
8
-
9
-
10
-
11
-
12
-
13
-
14
-
15
-
16
-
17
-
18
-
19
-
20
-
21
-
22
-
23
-
24
-
25
-
26
-
27
-
28
-
29
-
30
-
31
-
32
-
33
-
34
-
35
-
36
-
37
-
38
-
39
-
40
-
41
-
42
-
43
-
44
-
45
-
46
-
47
-
48
-
49
-
50
-
51
-
52
-
53
-
54
-
55
-
56
-
57
-
58
-
59
-
60
-
61
-
 62
62 -
 63
63 -
 64
64 -
 65
65 -
 66
66 -
 67
67 -
 68
68 -
 69
69 -
 70
70 -
 71
71 -
 72
72 -
 73
73 -
 74
74 -
 75
75 -
 76
76 -
 77
77 -
 78
78 -
 79
79 -
 80
80 -
 81
81 -
 82
82 -
83
-
84
-
85
-
86
-
87
-
88
-
89
-
90
-
91
-
92
-
93
-
94
-
95
-
96
-
97
-
98
-
99
-
100
-
101
-
102
-
103
-
104
-
105
-
106
-
107
-
108
-
109
-
110
-
111
-
112
-
113
-
114
-
115
-
116
-
117
-
118
-
119
-
120
-
121
 |
 |

72
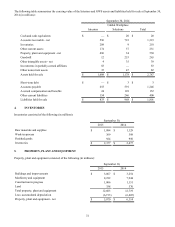
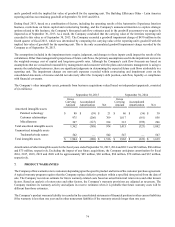
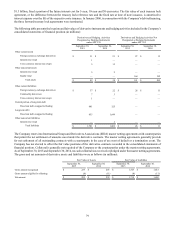
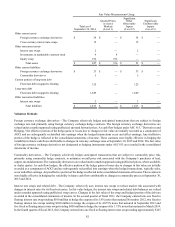
The following table summarizes the carrying value of the Interiors and GWS assets and liabilities held for sale at September 30,
2014 (in millions):
September 30, 2014
Global Workplace
Interiors Solutions Total
Cash and cash equivalents $ — $ 20 $ 20
Accounts receivable - net 596 723 1,319
Inventories 209 9 218
Other current assets 174 57 231
Property, plant and equipment - net 496 34 530
Goodwill 12 253 265
Other intangible assets - net 4 35 39
Investments in partially-owned affiliates 83 — 83
Other noncurrent assets 35 47 82
Assets held for sale $ 1,609 $ 1,178 $ 2,787
Short-term debt $ — $ 3 $ 3
Accounts payable 655 591 1,246
Accrued compensation and benefits 24 128 152
Other current liabilities 154 246 400
Liabilities held for sale $ 833 $ 968 $ 1,801
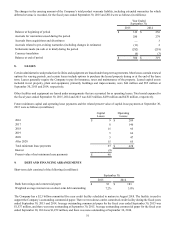
4. INVENTORIES
Inventories consisted of the following (in millions):
September 30,
2015 2014
Raw materials and supplies $ 1,084 $ 1,129
Work-in-process 369 398
Finished goods 924 950
Inventories $ 2,377 $ 2,477
5. PROPERTY, PLANT AND EQUIPMENT
Property, plant and equipment consisted of the following (in millions):
September 30,
2015 2014
Buildings and improvements $ 3,067 $ 3,254
Machinery and equipment 8,192 7,944
Construction in progress 1,006 1,151
Land 338 370
Total property, plant and equipment 12,603 12,719
Less: accumulated depreciation (6,733)(6,405)
Property, plant and equipment - net $ 5,870 $ 6,314