Johnson Controls 2015 Annual Report Download - page 29
Download and view the complete annual report
Please find page 29 of the 2015 Johnson Controls annual report below. You can navigate through the pages in the report by either clicking on the pages listed below, or by using the keyword search tool below to find specific information within the annual report.
29
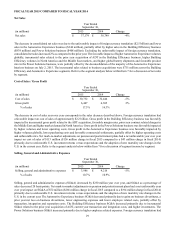
FISCAL YEAR 2015 COMPARED TO FISCAL YEAR 2014
Net Sales
Year Ended
September 30,
(in millions) 2015 2014 Change
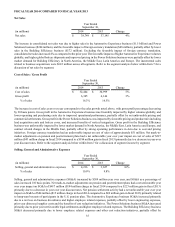
Net sales $ 37,179 $ 38,749 -4%
The decrease in consolidated net sales was due to the unfavorable impact of foreign currency translation ($2.5 billion) and lower
sales in the Automotive Experience business ($344 million), partially offset by higher sales in the Building Efficiency business
($839 million) and Power Solutions business ($408 million). Excluding the unfavorable impact of foreign currency translation,
consolidated net sales increased 2% as compared to the prior year. The favorable impacts of higher Automotive Experience volumes
globally, incremental sales related to the prior year acquisition of ADT in the Building Efficiency business, higher Building
Efficiency volumes in North America and the Middle East markets, and higher global battery shipments and favorable product
mix in the Power Solutions business, were partially offset by the deconsolidation of the majority of the Automotive Experience
Interiors business on July 2, 2015. The incremental sales related to business acquisitions were $751 million across the Building
Efficiency and Automotive Experience segments. Refer to the segment analysis below within Item 7 for a discussion of net sales
by segment.
Cost of Sales / Gross Profit
Year Ended
September 30,
(in millions) 2015 2014 Change
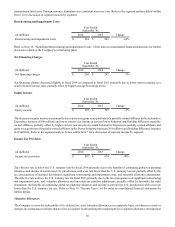
Cost of sales $ 30,732 $ 32,444 -5%
Gross profit 6,447 6,305 2%
% of sales 17.3% 16.3%
The decrease in cost of sales year over year corresponds to the sales decrease described above. Foreign currency translation had
a favorable impact on cost of sales of approximately $2.2 billion. Gross profit in the Building Efficiency business was favorably
impacted by incremental gross profit related to the ADT acquisition, favorable margin rates, prior year contract related charges in
the Middle East and higher market demand in North America. Gross profit in the Power Solutions business was favorably impacted
by higher volumes and lower operating costs. Gross profit in the Automotive Experience business was favorably impacted by
higher volumes globally, lower purchasing costs and favorable commercial settlements, partially offset by higher operating costs
and unfavorable mix. Net mark-to-market adjustments on pension and postretirement plans had a net unfavorable year over year
impact on cost of sales of $113 million ($156 million charge in fiscal 2015 compared to a $43 million charge in fiscal 2014)
primarily due to unfavorable U.S. investment returns versus expectations and the adoption of new mortality rate changes in the
U.S. in the current year. Refer to the segment analysis below within Item 7 for a discussion of segment income by segment.
Selling, General and Administrative Expenses
Year Ended
September 30,
(in millions) 2015 2014 Change
Selling, general and administrative expenses $ 3,986 $ 4,216 -5%
% of sales 10.7% 10.9%
Selling, general and administrative expenses (SG&A) decreased by $230 million year over year, and SG&A as a percentage of
sales decreased 20 basis points. Net mark-to-market adjustments on pension and postretirement plans had a net unfavorable year
over year impact on SG&A of $72 million ($266 million charge in fiscal 2015 compared to a $194 million charge in fiscal 2014)
primarily due to unfavorable U.S. investment returns versus expectations and the adoption of new mortality rate changes in the
U.S. in the current year. The Automotive Experience business SG&A decreased primarily due to gains on business divestitures, a
prior year net loss on business divestitures, lower engineering expenses and lower employee related costs, partially offset by
transaction, integration and separation costs. The Building Efficiency business SG&A increased primarily due to incremental
SG&A related to the prior year acquisition of ADT, current year transaction and integration costs, and higher investments. The
Power Solutions business SG&A increased primarily due to higher employee related expenses. Foreign currency translation had


