Johnson Controls 2015 Annual Report Download - page 87
Download and view the complete annual report
Please find page 87 of the 2015 Johnson Controls annual report below. You can navigate through the pages in the report by either clicking on the pages listed below, or by using the keyword search tool below to find specific information within the annual report.-
 1
1 -
2
-
3
-
4
-
5
-
6
-
7
-
8
-
9
-
10
-
11
-
12
-
13
-
14
-
15
-
16
-
17
-
18
-
19
-
20
-
21
-
22
-
23
-
24
-
25
-
26
-
27
-
28
-
29
-
30
-
31
-
32
-
33
-
34
-
35
-
36
-
37
-
38
-
39
-
40
-
41
-
42
-
43
-
44
-
45
-
46
-
47
-
48
-
49
-
50
-
51
-
52
-
53
-
54
-
55
-
56
-
57
-
58
-
59
-
60
-
61
-
62
-
63
-
64
-
65
-
66
-
67
-
68
-
69
-
70
-
71
-
72
-
73
-
74
-
75
-
76
-
 77
77 -
 78
78 -
 79
79 -
 80
80 -
 81
81 -
 82
82 -
 83
83 -
 84
84 -
 85
85 -
 86
86 -
 87
87 -
 88
88 -
 89
89 -
 90
90 -
 91
91 -
 92
92 -
 93
93 -
 94
94 -
 95
95 -
 96
96 -
 97
97 -
98
-
99
-
100
-
101
-
102
-
103
-
104
-
105
-
106
-
107
-
108
-
109
-
110
-
111
-
112
-
113
-
114
-
115
-
116
-
117
-
118
-
119
-
120
-
121
 |
 |

87
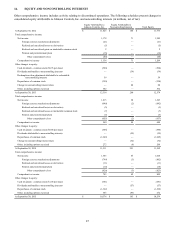
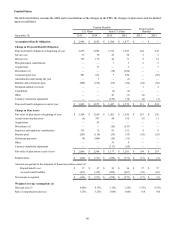
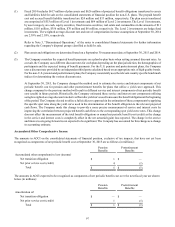
14. EQUITY AND NONCONTROLLING INTERESTS
Other comprehensive income includes activity relating to discontinued operations. The following schedules present changes in
consolidated equity attributable to Johnson Controls, Inc. and noncontrolling interests (in millions, net of tax):
Equity Attributable to
Johnson Controls, Inc. Equity Attributable to
Noncontrolling Interests Total Equity
At September 30, 2012 $ 11,625 $ 148 $ 11,773
Total comprehensive income:
Net income 1,178 71 1,249
Foreign currency translation adjustments (21) — (21)
Realized and unrealized losses on derivatives (5) — (5)
Realized and unrealized gains on marketable common stock 2 — 2
Pension and postretirement plans (16) — (16)
Other comprehensive loss (40) — (40)
Comprehensive income 1,138 71 1,209
Other changes in equity:
Cash dividends - common stock ($0.76 per share) (520) — (520)
Dividends attributable to noncontrolling interests — (39) (39)
Redemption value adjustment attributable to redeemable
noncontrolling interests 59 — 59
Repurchases of common stock (350) — (350)
Change in noncontrolling interest share — 80 80
Other, including options exercised 362 — 362
At September 30, 2013 12,314 260 12,574
Total comprehensive income:
Net income 1,215 90 1,305
Foreign currency translation adjustments (640) (2) (642)
Realized and unrealized losses on derivatives (3) — (3)
Realized and unrealized losses on marketable common stock (7) — (7)
Pension and postretirement plans (5) — (5)
Other comprehensive loss (655) (2) (657)
Comprehensive income 560 88 648
Other changes in equity:
Cash dividends - common stock ($0.88 per share) (586) — (586)
Dividends attributable to noncontrolling interests — (59) (59)
Repurchases of common stock (1,249) — (1,249)
Change in noncontrolling interest share — (32) (32)
Other, including options exercised 272 (6) 266
At September 30, 2014 11,311 251 11,562
Total comprehensive income:
Net income 1,563 65 1,628
Foreign currency translation adjustments (799) (3) (802)
Realized and unrealized losses on derivatives (11) — (11)
Pension and postretirement plans (10) — (10)
Other comprehensive loss (820) (3) (823)
Comprehensive income 743 62 805
Other changes in equity:
Cash dividends - common stock ($1.04 per share) (681) — (681)
Dividends attributable to noncontrolling interests — (57) (57)
Repurchases of common stock (1,362) — (1,362)
Other, including options exercised 365 (93) 272
At September 30, 2015 $ 10,376 $ 163 $ 10,539