Johnson Controls 2015 Annual Report Download - page 97
Download and view the complete annual report
Please find page 97 of the 2015 Johnson Controls annual report below. You can navigate through the pages in the report by either clicking on the pages listed below, or by using the keyword search tool below to find specific information within the annual report.-
 1
1 -
2
-
3
-
4
-
5
-
6
-
7
-
8
-
9
-
10
-
11
-
12
-
13
-
14
-
15
-
16
-
17
-
18
-
19
-
20
-
21
-
22
-
23
-
24
-
25
-
26
-
27
-
28
-
29
-
30
-
31
-
32
-
33
-
34
-
35
-
36
-
37
-
38
-
39
-
40
-
41
-
42
-
43
-
44
-
45
-
46
-
47
-
48
-
49
-
50
-
51
-
52
-
53
-
54
-
55
-
56
-
57
-
58
-
59
-
60
-
61
-
62
-
63
-
64
-
65
-
66
-
67
-
68
-
69
-
70
-
71
-
72
-
73
-
74
-
75
-
76
-
77
-
78
-
79
-
80
-
81
-
82
-
83
-
84
-
85
-
86
-
 87
87 -
 88
88 -
 89
89 -
 90
90 -
 91
91 -
 92
92 -
 93
93 -
 94
94 -
 95
95 -
 96
96 -
 97
97 -
 98
98 -
 99
99 -
 100
100 -
 101
101 -
 102
102 -
 103
103 -
 104
104 -
 105
105 -
 106
106 -
 107
107 -
108
-
109
-
110
-
111
-
112
-
113
-
114
-
115
-
116
-
117
-
118
-
119
-
120
-
121
 |
 |

97
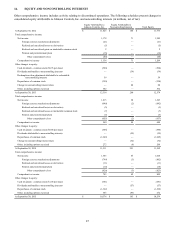
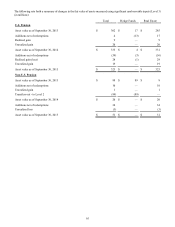
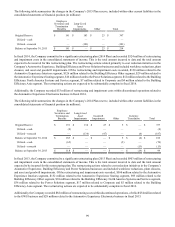
(1) Fiscal 2014 includes $617 million of plan assets and $626 million of projected benefit obligations transferred to assets
and liabilities held for sale on the consolidated statements of financial position for non-U.S. plans. The prepaid benefit
cost and accrued benefit liability transferred are $24 million and $33 million, respectively. The plan assets transferred
are comprised of $553 million of Level 1 investments and $64 million of Level 2 investments. The Level 1 investments,
by asset category, are cash, equity securities, fixed income securities, real estate and commodities in the amounts of $11
million, $110 million, $356 million, $70 million and $6 million, respectively. The Level 2 investments are hedge fund
investments. The weighted average discount rate and rate of compensation increase assumptions at September 30, 2014
are 2.30% and 2.10%, respectively.
Refer to Note 3, "Discontinued Operations," of the notes to consolidated financial statements for further information
regarding the Company's disposal groups classified as held for sale.
(2) Plan assets and obligations are determined based on a September 30 measurement date at September 30, 2015 and 2014.
(3) The Company considers the expected benefit payments on a plan-by-plan basis when setting assumed discount rates. As
a result, the Company uses different discount rates for each plan depending on the plan jurisdiction, the demographics of
participants and the expected timing of benefit payments. For the U.S. pension and postretirement plans, the Company
uses a discount rate provided by an independent third party calculated based on an appropriate mix of high quality bonds.
For the non-U.S. pension and postretirement plans, the Company consistently uses the relevant country specific benchmark
indices for determining the various discount rates.
At September 30, 2015, the Company changed the method used to estimate the service and interest components of net
periodic benefit cost for pension and other postretirement benefits for plans that utilize a yield curve approach. This
change compared to the previous method will result in different service and interest components of net periodic benefit
cost (credit) in future periods. Historically, the Company estimated these service and interest cost components utilizing
a single weighted-average discount rate derived from the yield curve used to measure the benefit obligation at the beginning
of the period. The Company elected to utilize a full yield curve approach in the estimation of these components by applying
the specific spot rates along the yield curve used in the determination of the benefit obligation to the relevant projected
cash flows. The Company made this change to provide a more precise measurement of service and interest costs by
improving the correlation between projected benefit cash flows to the corresponding spot yield curve rates. This change
does not affect the measurement of the total benefit obligations or annual net periodic benefit cost (credit) as the change
in the service and interest costs is completely offset in the net actuarial (gain) loss reported. The change in the service
and interest costs going forward is not expected to be significant. The Company has accounted for this change as a change
in accounting estimate.
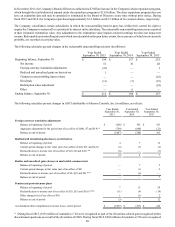
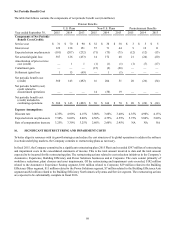
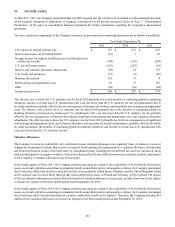
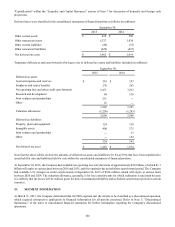
Accumulated Other Comprehensive Income
The amounts in AOCI on the consolidated statements of financial position, exclusive of tax impacts, that have not yet been
recognized as components of net periodic benefit cost at September 30, 2015 are as follows (in millions):
Pension
Benefits Postretirement
Benefits
Accumulated other comprehensive loss (income)
Net transition obligation $ 1 $ —
Net prior service cost (credit) 4(1)
Total $ 5 $ (1)
The amounts in AOCI expected to be recognized as components of net periodic benefit cost over the next fiscal year are shown
below (in millions):
Pension
Benefits Postretirement
Benefits
Amortization of:
Net transition obligation $ — $ —
Net prior service cost (credit) 1(1)
Total $ 1 $ (1)