Johnson Controls 2015 Annual Report Download - page 110
Download and view the complete annual report
Please find page 110 of the 2015 Johnson Controls annual report below. You can navigate through the pages in the report by either clicking on the pages listed below, or by using the keyword search tool below to find specific information within the annual report.-
 1
1 -
2
-
3
-
4
-
5
-
6
-
7
-
8
-
9
-
10
-
11
-
12
-
13
-
14
-
15
-
16
-
17
-
18
-
19
-
20
-
21
-
22
-
23
-
24
-
25
-
26
-
27
-
28
-
29
-
30
-
31
-
32
-
33
-
34
-
35
-
36
-
37
-
38
-
39
-
40
-
41
-
42
-
43
-
44
-
45
-
46
-
47
-
48
-
49
-
50
-
51
-
52
-
53
-
54
-
55
-
56
-
57
-
58
-
59
-
60
-
61
-
62
-
63
-
64
-
65
-
66
-
67
-
68
-
69
-
70
-
71
-
72
-
73
-
74
-
75
-
76
-
77
-
78
-
79
-
80
-
81
-
82
-
83
-
84
-
85
-
86
-
87
-
88
-
89
-
90
-
91
-
92
-
93
-
94
-
95
-
96
-
97
-
98
-
99
-
 100
100 -
 101
101 -
 102
102 -
 103
103 -
 104
104 -
 105
105 -
 106
106 -
 107
107 -
 108
108 -
 109
109 -
 110
110 -
 111
111 -
 112
112 -
 113
113 -
 114
114 -
 115
115 -
 116
116 -
 117
117 -
 118
118 -
 119
119 -
 120
120 -
121
 |
 |

110
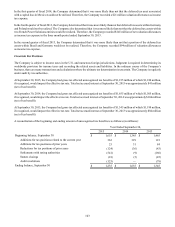
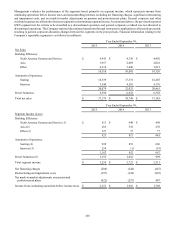
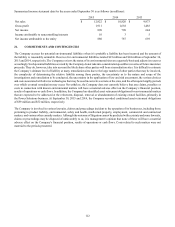
Year Ended September 30,
2015 2014 2013
Capital Expenditures
Building Efficiency
North America Systems and Service $ 37 $ 37 $ 12
Global Workplace Solutions 16 16 7
Asia 30 26 73
Other 185 160 106
268 239 198
Automotive Experience
Seating 437 420 467
Interiors 121 181 235
Electronics — 31 52
558 632 754
Power Solutions 309 328 425
Total $ 1,135 $ 1,199 $ 1,377
(1) Building Efficiency - North America Systems and Service segment income for the years ended September 30, 2015, 2014
and 2013 excludes $2 million, $12 million and $38 million, respectively, of restructuring and impairment costs.
(2) Building Efficiency - Asia segment income for the years ended September 30, 2015, 2014 and 2013 excludes $7 million,
$4 million and $5 million, respectively, of restructuring and impairment costs. For the years ended September 30, 2014
and 2013, Asia segment income includes $21 million and $2 million, respectively, of equity income.
(3) Building Efficiency - Other segment income for the years ended September 30, 2015, 2014 and 2013 excludes $29 million,
$126 million and $95 million, respectively, of restructuring and impairment costs. For the years ended September 30,
2015, 2014 and 2013, Other segment income includes $23 million, $14 million and $26 million, respectively, of equity
income.
(4) Automotive Experience - Seating segment income for the years ended September 30, 2015, 2014 and 2013 excludes $182
million, $29 million and $152 million, respectively, of restructuring and impairment costs. For the years ended
September 30, 2015, 2014 and 2013, Seating segment income includes $264 million, $250 million and $287 million,
respectively, of equity income.
(5) Automotive Experience - Interiors segment income for the years ended September 30, 2014 and 2013 excludes $130
million and $560 million, respectively, of restructuring and impairment costs. For the years ended September 30, 2015,
2014 and 2013, Interiors segment income includes $31 million, $35 million and $16 million, respectively, of equity
income.
(6) Power Solutions segment income for the years ended September 30, 2015, 2014 and 2013 excludes $11 million, $16
million and $36 million, respectively, of restructuring and impairment costs. For the years ended September 30, 2015,
2014 and 2013, Power Solutions segment income includes $57 million, $75 million and $68 million, respectively, of
equity income.
(7) Current year and prior year amounts exclude assets held for sale. Refer to Note 3, "Discontinued Operations," of the notes
to consolidated financial statements for further information regarding the Company's disposal groups classified as held
for sale.
The Company has significant sales to the automotive industry. In fiscal years 2015, 2014 and 2013, no customer exceeded 10%
of consolidated net sales.