Johnson Controls 2015 Annual Report Download - page 108
Download and view the complete annual report
Please find page 108 of the 2015 Johnson Controls annual report below. You can navigate through the pages in the report by either clicking on the pages listed below, or by using the keyword search tool below to find specific information within the annual report.-
 1
1 -
2
-
3
-
4
-
5
-
6
-
7
-
8
-
9
-
10
-
11
-
12
-
13
-
14
-
15
-
16
-
17
-
18
-
19
-
20
-
21
-
22
-
23
-
24
-
25
-
26
-
27
-
28
-
29
-
30
-
31
-
32
-
33
-
34
-
35
-
36
-
37
-
38
-
39
-
40
-
41
-
42
-
43
-
44
-
45
-
46
-
47
-
48
-
49
-
50
-
51
-
52
-
53
-
54
-
55
-
56
-
57
-
58
-
59
-
60
-
61
-
62
-
63
-
64
-
65
-
66
-
67
-
68
-
69
-
70
-
71
-
72
-
73
-
74
-
75
-
76
-
77
-
78
-
79
-
80
-
81
-
82
-
83
-
84
-
85
-
86
-
87
-
88
-
89
-
90
-
91
-
92
-
93
-
94
-
95
-
96
-
97
-
 98
98 -
 99
99 -
 100
100 -
 101
101 -
 102
102 -
 103
103 -
 104
104 -
 105
105 -
 106
106 -
 107
107 -
 108
108 -
 109
109 -
 110
110 -
 111
111 -
 112
112 -
 113
113 -
 114
114 -
 115
115 -
 116
116 -
 117
117 -
 118
118 -
119
-
120
-
121
 |
 |

108
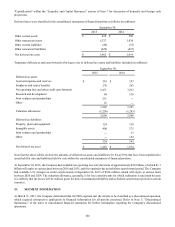
Management evaluates the performance of the segments based primarily on segment income, which represents income from
continuing operations before income taxes and noncontrolling interests excluding net financing charges, significant restructuring
and impairment costs, and net mark-to-market adjustments on pension and postretirement plans. General corporate and other
overhead expenses are allocated to business segments in determining segment income. As mentioned above, the previously reported
GWS segment met the criteria to be classified as a discontinued operation, and general corporate overhead was not allocated to
discontinued operations. The Company reported discontinued operations through retrospective application to all periods presented,
resulting in general corporate allocation changes between the segments in the prior periods. Financial information relating to the
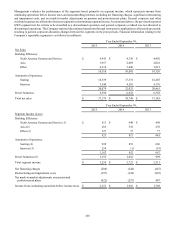
Company’s reportable segments is as follows (in millions):
Year Ended September 30,
2015 2014 2013
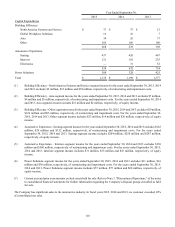
Net Sales
Building Efficiency
North America Systems and Service $ 4,443 $ 4,336 $ 4,492
Asia 1,957 2,069 2,022
Other 4,110 3,680 3,812
10,510 10,085 10,326
Automotive Experience
Seating 16,539 17,531 16,285
Interiors 3,540 4,501 4,176
20,079 22,032 20,461
Power Solutions 6,590 6,632 6,358
Total net sales $ 37,179 $ 38,749 $ 37,145
Year Ended September 30,
2015 2014 2013
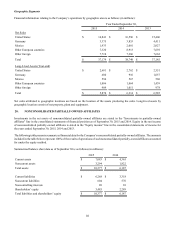
Segment Income (Loss)
Building Efficiency
North America Systems and Service (1) $ 513 $ 448 $ 498
Asia (2) 283 332 270
Other (3) 127 37 77
923 817 845
Automotive Experience
Seating (4) 928 853 686
Interiors (5) 254 (1)(19)
1,182 852 667
Power Solutions (6) 1,153 1,052 999
Total segment income $ 3,258 $ 2,721 $ 2,511
Net financing charges (288)(244)(247)
Restructuring and impairment costs (397)(324)(903)
Net mark-to-market adjustments on pension and
postretirement plans (422)(237) 407
Income from continuing operations before income taxes $ 2,151 $ 1,916 $ 1,768