Johnson Controls 2015 Annual Report Download - page 34
Download and view the complete annual report
Please find page 34 of the 2015 Johnson Controls annual report below. You can navigate through the pages in the report by either clicking on the pages listed below, or by using the keyword search tool below to find specific information within the annual report.-
 1
1 -
2
-
3
-
4
-
5
-
6
-
7
-
8
-
9
-
10
-
11
-
12
-
13
-
14
-
15
-
16
-
17
-
18
-
19
-
20
-
21
-
22
-
23
-
 24
24 -
 25
25 -
 26
26 -
 27
27 -
 28
28 -
 29
29 -
 30
30 -
 31
31 -
 32
32 -
 33
33 -
 34
34 -
 35
35 -
 36
36 -
 37
37 -
 38
38 -
 39
39 -
 40
40 -
 41
41 -
 42
42 -
 43
43 -
 44
44 -
45
-
46
-
47
-
48
-
49
-
50
-
51
-
52
-
53
-
54
-
55
-
56
-
57
-
58
-
59
-
60
-
61
-
62
-
63
-
64
-
65
-
66
-
67
-
68
-
69
-
70
-
71
-
72
-
73
-
74
-
75
-
76
-
77
-
78
-
79
-
80
-
81
-
82
-
83
-
84
-
85
-
86
-
87
-
88
-
89
-
90
-
91
-
92
-
93
-
94
-
95
-
96
-
97
-
98
-
99
-
100
-
101
-
102
-
103
-
104
-
105
-
106
-
107
-
108
-
109
-
110
-
111
-
112
-
113
-
114
-
115
-
116
-
117
-
118
-
119
-
120
-
121
 |
 |

34
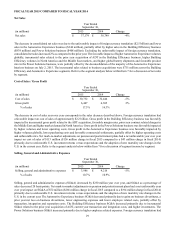
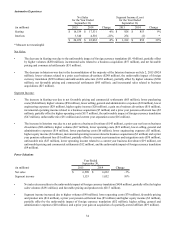
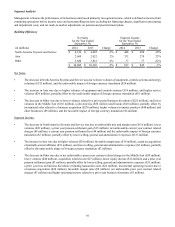
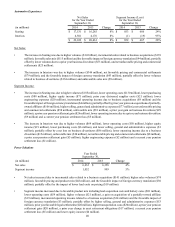
Automotive Experience
Net Sales
for the Year Ended
September 30,
Segment Income (Loss)
for the Year Ended
September 30,
(in millions) 2015 2014 Change 2015 2014 Change
Seating $ 16,539 $ 17,531 -6% $ 928 $ 853 9%
Interiors 3,540 4,501 -21% 254 (1) *
$ 20,079 $ 22,032 -9% $ 1,182 $ 852 39%
* Measure not meaningful
Net Sales:
• The decrease in Seating was due to the unfavorable impact of foreign currency translation ($1.4 billion), partially offset
by higher volumes ($280 million), incremental sales related to a business acquisition ($57 million), and net favorable
pricing and commercial settlements ($51 million).
• The decrease in Interiors was due to the deconsolidation of the majority of the Interiors business on July 2, 2015 ($924
million), lower volumes related to a prior year business divestiture ($248 million), the unfavorable impact of foreign
currency translation ($229 million) and unfavorable sales mix ($138 million), partially offset by higher volumes ($506
million), net favorable pricing and commercial settlements ($45 million), and incremental sales related to business
acquisitions ($27 million).
Segment Income:
• The increase in Seating was due to net favorable pricing and commercial settlements ($65 million), lower purchasing
costs ($64 million), higher volumes ($56 million), lower selling, general and administrative expenses ($30 million), lower
engineering expenses ($29 million), higher equity income ($20 million), a gain on a business divestiture ($10 million),
incremental operating income related to a business acquisition ($7 million) and a prior year pension settlement loss ($5
million), partially offset by higher operating costs ($117 million), the unfavorable impact of foreign currency translation
($47 million), unfavorable mix ($31 million) and current year separation costs ($16 million).
• The increase in Interiors was due to a net gain on a business divestiture ($145 million), a prior year net loss on business
divestitures ($86 million), higher volumes ($67 million), lower operating costs ($23 million), lower selling, general and
administrative expenses ($16 million), lower purchasing costs ($6 million), lower engineering expenses ($5 million),
higher equity income ($3 million), incremental operating income related to business acquisitions ($3 million) and a prior
year pension settlement loss ($1 million), partially offset by current year transaction and integration costs ($38 million),
unfavorable mix ($27 million), lower operating income related to a current year business divestiture ($19 million), net
unfavorable pricing and commercial settlements ($12 million), and the unfavorable impact of foreign currency translation
($4 million).
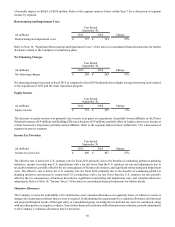
Power Solutions
Year Ended
September 30,
(in millions) 2015 2014 Change
Net sales $ 6,590 $ 6,632 -1%
Segment income 1,153 1,052 10%
• Net sales decreased due to the unfavorable impact of foreign currency translation ($450 million), partially offset by higher
sales volumes ($291 million), and favorable pricing and product mix ($117 million).
• Segment income increased due to higher volumes ($90 million), lower operating costs ($79 million), favorable pricing
and product mix ($16 million), a prior year pension settlement loss ($5 million) and higher equity income ($2 million),
partially offset by the unfavorable impact of foreign currency translation ($52 million), higher selling, general and
administrative expenses ($20 million), and a prior year gain on acquisition of a partially-owned affiliate ($19 million).