Johnson Controls 2015 Annual Report Download - page 74
Download and view the complete annual report
Please find page 74 of the 2015 Johnson Controls annual report below. You can navigate through the pages in the report by either clicking on the pages listed below, or by using the keyword search tool below to find specific information within the annual report.-
 1
1 -
2
-
3
-
4
-
5
-
6
-
7
-
8
-
9
-
10
-
11
-
12
-
13
-
14
-
15
-
16
-
17
-
18
-
19
-
20
-
21
-
22
-
23
-
24
-
25
-
26
-
27
-
28
-
29
-
30
-
31
-
32
-
33
-
34
-
35
-
36
-
37
-
38
-
39
-
40
-
41
-
42
-
43
-
44
-
45
-
46
-
47
-
48
-
49
-
50
-
51
-
52
-
53
-
54
-
55
-
56
-
57
-
58
-
59
-
60
-
61
-
62
-
63
-
 64
64 -
 65
65 -
 66
66 -
 67
67 -
 68
68 -
 69
69 -
 70
70 -
 71
71 -
 72
72 -
 73
73 -
 74
74 -
 75
75 -
 76
76 -
 77
77 -
 78
78 -
 79
79 -
 80
80 -
 81
81 -
 82
82 -
 83
83 -
 84
84 -
85
-
86
-
87
-
88
-
89
-
90
-
91
-
92
-
93
-
94
-
95
-
96
-
97
-
98
-
99
-
100
-
101
-
102
-
103
-
104
-
105
-
106
-
107
-
108
-
109
-
110
-
111
-
112
-
113
-
114
-
115
-
116
-
117
-
118
-
119
-
120
-
121
 |
 |

74
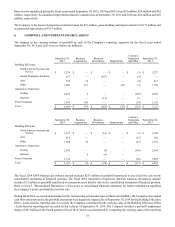
unit's goodwill with the implied fair value of goodwill for the reporting unit. The Building Efficiency Other - Latin America
reporting unit has no remaining goodwill at September 30, 2015 and 2014.
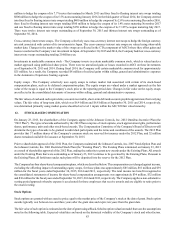
During fiscal 2013, based on a combination of factors, including the operating results of the Automotive Experience Interiors
business, restrictions on future capital and restructuring funding, and the Company's announced intention to explore strategic
options related to this business, the Company's forecasted cash flow estimates used in the goodwill assessment were negatively
impacted as of September 30, 2013. As a result, the Company concluded that the carrying value of the Interiors reporting unit
exceeded its fair value as of September 30, 2013. The Company recorded a goodwill impairment charge of $430 million in the
fourth quarter of fiscal 2013, which was determined by comparing the carrying value of the reporting unit's goodwill with the
implied fair value of goodwill for the reporting unit. This is the only accumulated goodwill impairment charge recorded by the
Company as of September 30, 2013.
The assumptions included in the impairment tests require judgment, and changes to these inputs could impact the results of the
calculations. Other than management's projections of future cash flows, the primary assumptions used in the impairment tests were
the weighted-average cost of capital and long-term growth rates. Although the Company's cash flow forecasts are based on
assumptions that are considered reasonable by management and consistent with the plans and estimates management is using to
operate the underlying businesses, there are significant judgments in determining the expected future cash flows attributable to a
reporting unit. The impairment charges are non-cash expenses recorded within restructuring and impairment costs on the
consolidated statements of income and did not adversely affect the Company's debt position, cash flow, liquidity or compliance
with financial covenants.
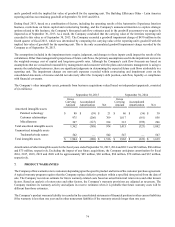
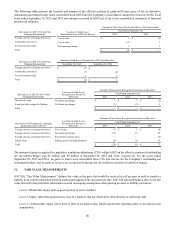
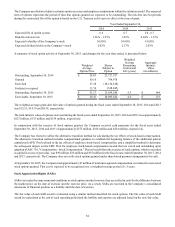
The Company’s other intangible assets, primarily from business acquisitions valued based on independent appraisals, consisted
of (in millions):
September 30, 2015 September 30, 2014
Gross
Carrying
Amount Accumulated
Amortization Net
Gross
Carrying
Amount Accumulated
Amortization Net
Amortized intangible assets
Patented technology $ 80 $ (59) $ 21 $ 86 $ (56) $ 30
Customer relationships 975 (206) 769 1,017 (161) 856
Miscellaneous 307 (123) 184 312 (106) 206
Total amortized intangible assets 1,362 (388) 974 1,415 (323) 1,092
Unamortized intangible assets
Trademarks/trade names 542 — 542 547 — 547
Total intangible assets $ 1,904 $ (388) $ 1,516 $ 1,962 $ (323) $ 1,639
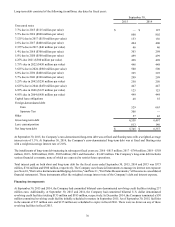
Amortization of other intangible assets for the fiscal years ended September 30, 2015, 2014 and 2013 was $92 million, $86 million
and $75 million, respectively. Excluding the impact of any future acquisitions, the Company anticipates amortization for fiscal
2016, 2017, 2018, 2019 and 2020 will be approximately $89 million, $86 million, $84 million, $78 million and $67 million,
respectively.
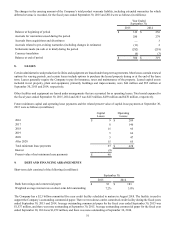
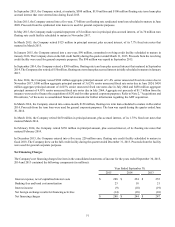
7. PRODUCT WARRANTIES
The Company offers warranties to its customers depending upon the specific product and terms of the customer purchase agreement.
A typical warranty program requires that the Company replace defective products within a specified time period from the date of
sale. The Company records an estimate for future warranty-related costs based on actual historical return rates and other known
factors. Based on analysis of return rates and other factors, the Company’s warranty provisions are adjusted as necessary. The
Company monitors its warranty activity and adjusts its reserve estimates when it is probable that future warranty costs will be
different than those estimates.
The Company’s product warranty liability is recorded in the consolidated statements of financial position in other current liabilities
if the warranty is less than one year and in other noncurrent liabilities if the warranty extends longer than one year.