Johnson Controls 2015 Annual Report Download - page 111
Download and view the complete annual report
Please find page 111 of the 2015 Johnson Controls annual report below. You can navigate through the pages in the report by either clicking on the pages listed below, or by using the keyword search tool below to find specific information within the annual report.-
 1
1 -
2
-
3
-
4
-
5
-
6
-
7
-
8
-
9
-
10
-
11
-
12
-
13
-
14
-
15
-
16
-
17
-
18
-
19
-
20
-
21
-
22
-
23
-
24
-
25
-
26
-
27
-
28
-
29
-
30
-
31
-
32
-
33
-
34
-
35
-
36
-
37
-
38
-
39
-
40
-
41
-
42
-
43
-
44
-
45
-
46
-
47
-
48
-
49
-
50
-
51
-
52
-
53
-
54
-
55
-
56
-
57
-
58
-
59
-
60
-
61
-
62
-
63
-
64
-
65
-
66
-
67
-
68
-
69
-
70
-
71
-
72
-
73
-
74
-
75
-
76
-
77
-
78
-
79
-
80
-
81
-
82
-
83
-
84
-
85
-
86
-
87
-
88
-
89
-
90
-
91
-
92
-
93
-
94
-
95
-
96
-
97
-
98
-
99
-
100
-
 101
101 -
 102
102 -
 103
103 -
 104
104 -
 105
105 -
 106
106 -
 107
107 -
 108
108 -
 109
109 -
 110
110 -
 111
111 -
 112
112 -
 113
113 -
 114
114 -
 115
115 -
 116
116 -
 117
117 -
 118
118 -
 119
119 -
 120
120 -
 121
121
 |
 |

111
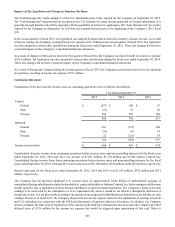
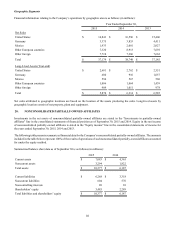
Geographic Segments
Financial information relating to the Company’s operations by geographic area is as follows (in millions):
Year Ended September 30,
2015 2014 2013
Net Sales
United States $ 16,841 $ 16,596 $ 15,406
Germany 3,375 3,853 4,411
Mexico 1,933 2,001 2,027
Other European countries 7,320 8,913 7,639
Other foreign 7,710 7,386 7,662
Total $ 37,179 $ 38,749 $ 37,145
Long-Lived Assets (Year-end)
United States $ 2,681 $ 2,762 $ 2,551
Germany 680 910 1,057
Mexico 594 567 560
Other European countries 1,006 1,064 1,439
Other foreign 909 1,011 978
Total $ 5,870 $ 6,314 $ 6,585
Net sales attributed to geographic locations are based on the location of the assets producing the sales. Long-lived assets by
geographic location consist of net property, plant and equipment.
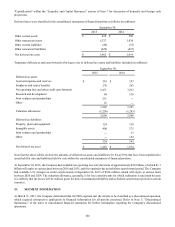
20. NONCONSOLIDATED PARTIALLY-OWNED AFFILIATES
Investments in the net assets of nonconsolidated partially-owned affiliates are stated in the "Investments in partially-owned
affiliates" line in the consolidated statements of financial position as of September 30, 2015 and 2014. Equity in the net income
of nonconsolidated partially-owned affiliates is stated in the "Equity income" line in the consolidated statements of income for
the years ended September 30, 2015, 2014 and 2013.
The following table presents summarized financial data for the Company’s nonconsolidated partially-owned affiliates. The amounts
included in the table below represent 100% of the results of operations of such nonconsolidated partially-owned affiliates accounted
for under the equity method.
Summarized balance sheet data as of September 30 is as follows (in millions):
2015 2014
Current assets $ 7,083 $ 4,365
Noncurrent assets 3,294 1,822
Total assets $ 10,377 $ 6,187
Current liabilities $ 6,268 $ 3,318
Noncurrent liabilities 604 570
Noncontrolling interests 20 10
Shareholders’ equity 3,485 2,289
Total liabilities and shareholders’ equity $ 10,377 $ 6,187