Johnson Controls 2015 Annual Report Download - page 27
Download and view the complete annual report
Please find page 27 of the 2015 Johnson Controls annual report below. You can navigate through the pages in the report by either clicking on the pages listed below, or by using the keyword search tool below to find specific information within the annual report.-
 1
1 -
2
-
3
-
4
-
5
-
6
-
7
-
8
-
9
-
10
-
11
-
12
-
13
-
14
-
15
-
16
-
 17
17 -
 18
18 -
 19
19 -
 20
20 -
 21
21 -
 22
22 -
 23
23 -
 24
24 -
 25
25 -
 26
26 -
 27
27 -
 28
28 -
 29
29 -
 30
30 -
 31
31 -
 32
32 -
 33
33 -
 34
34 -
 35
35 -
 36
36 -
 37
37 -
38
-
39
-
40
-
41
-
42
-
43
-
44
-
45
-
46
-
47
-
48
-
49
-
50
-
51
-
52
-
53
-
54
-
55
-
56
-
57
-
58
-
59
-
60
-
61
-
62
-
63
-
64
-
65
-
66
-
67
-
68
-
69
-
70
-
71
-
72
-
73
-
74
-
75
-
76
-
77
-
78
-
79
-
80
-
81
-
82
-
83
-
84
-
85
-
86
-
87
-
88
-
89
-
90
-
91
-
92
-
93
-
94
-
95
-
96
-
97
-
98
-
99
-
100
-
101
-
102
-
103
-
104
-
105
-
106
-
107
-
108
-
109
-
110
-
111
-
112
-
113
-
114
-
115
-
116
-
117
-
118
-
119
-
120
-
121
 |
 |

27
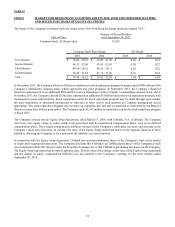
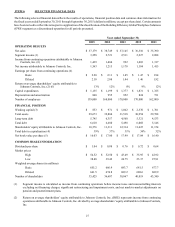
ITEM 6 SELECTED FINANCIAL DATA
The following selected financial data reflects the results of operations, financial position data and common share information for
the fiscal years ended September 30, 2011 through September 30, 2015 (dollars in millions, except per share data). Certain amounts
have been revised to reflect the retrospective application of the classification of the Building Efficiency Global Workplace Solutions
(GWS) segment as a discontinued operation for all periods presented.
Year ended September 30,
2015 2014 2013 2012 2011
OPERATING RESULTS
Net sales $ 37,179 $ 38,749 $ 37,145 $ 36,310 $ 35,390
Segment income (1) 3,258 2,721 2,511 2,227 2,088
Income from continuing operations attributable to Johnson
Controls, Inc. (6) 1,439 1,404 992 1,003 1,317
Net income attributable to Johnson Controls, Inc. 1,563 1,215 1,178 1,184 1,415
Earnings per share from continuing operations (6)
Basic $ 2.20 $ 2.11 $ 1.45 $ 1.47 $ 1.94
Diluted 2.18 2.08 1.44 1.46 1.92
Return on average shareholders’ equity attributable to
Johnson Controls, Inc. (2) (6) 13% 12% 8% 9% 12%
Capital expenditures $ 1,135 $ 1,199 $ 1,377 $ 1,831 $ 1,325
Depreciation and amortization 860 955 952 824 731
Number of employees 139,000 168,000 170,000 170,000 162,000
FINANCIAL POSITION
Working capital (3) $ 853 $ 971 $ 1,062 $ 2,370 $ 1,701
Total assets 29,673 32,804 31,518 30,954 29,788
Long-term debt 5,745 6,357 4,560 5,321 4,533
Total debt 6,610 6,680 5,498 6,068 5,146
Shareholders' equity attributable to Johnson Controls, Inc. 10,376 11,311 12,314 11,625 11,154
Total debt to capitalization (4) 39% 37% 31% 34% 32%
Net book value per share (5) $ 16.03 $ 17.00 $ 17.99 $ 17.04 $ 16.40
COMMON SHARE INFORMATION
Dividends per share $ 1.04 $ 0.88 $ 0.76 $ 0.72 $ 0.64
Market prices
High $ 54.52 $ 52.50 $ 43.49 $ 35.95 $ 42.92
Low 38.48 39.42 24.75 23.37 25.91
Weighted average shares (in millions)
Basic 655.2 666.9 683.7 681.5 677.7
Diluted 661.5 674.8 689.2 688.6 689.9
Number of shareholders 35,425 36,687 38,067 40,019 43,340
(1) Segment income is calculated as income from continuing operations before income taxes and noncontrolling interests
excluding net financing charges, significant restructuring and impairment costs, and net mark-to-market adjustments on
pension and postretirement plans.
(2) Return on average shareholders’ equity attributable to Johnson Controls, Inc. (ROE) represents income from continuing
operations attributable to Johnson Controls, Inc. divided by average shareholders’ equity attributable to Johnson Controls,
Inc.