Johnson Controls 2015 Annual Report Download - page 60
Download and view the complete annual report
Please find page 60 of the 2015 Johnson Controls annual report below. You can navigate through the pages in the report by either clicking on the pages listed below, or by using the keyword search tool below to find specific information within the annual report.-
 1
1 -
2
-
3
-
4
-
5
-
6
-
7
-
8
-
9
-
10
-
11
-
12
-
13
-
14
-
15
-
16
-
17
-
18
-
19
-
20
-
21
-
22
-
23
-
24
-
25
-
26
-
27
-
28
-
29
-
30
-
31
-
32
-
33
-
34
-
35
-
36
-
37
-
38
-
39
-
40
-
41
-
42
-
43
-
44
-
45
-
46
-
47
-
48
-
49
-
 50
50 -
 51
51 -
 52
52 -
 53
53 -
 54
54 -
 55
55 -
 56
56 -
 57
57 -
 58
58 -
 59
59 -
 60
60 -
 61
61 -
 62
62 -
 63
63 -
 64
64 -
 65
65 -
 66
66 -
 67
67 -
 68
68 -
 69
69 -
 70
70 -
71
-
72
-
73
-
74
-
75
-
76
-
77
-
78
-
79
-
80
-
81
-
82
-
83
-
84
-
85
-
86
-
87
-
88
-
89
-
90
-
91
-
92
-
93
-
94
-
95
-
96
-
97
-
98
-
99
-
100
-
101
-
102
-
103
-
104
-
105
-
106
-
107
-
108
-
109
-
110
-
111
-
112
-
113
-
114
-
115
-
116
-
117
-
118
-
119
-
120
-
121
 |
 |

60
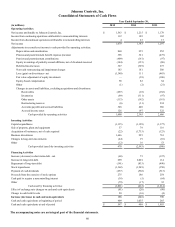
Johnson Controls, Inc.
Consolidated Statements of Cash Flows
Year Ended September 30,
(in millions) 2015 2014 2013
Operating Activities
Net income attributable to Johnson Controls, Inc. $ 1,563 $ 1,215 $ 1,178
Income from continuing operations attributable to noncontrolling interests 112 105 102
Income from discontinued operations attributable to noncontrolling interests 4 23 17
Net income 1,679 1,343 1,297
Adjustments to reconcile net income to cash provided by operating activities:
Depreciation and amortization 860 955 952
Pension and postretirement benefit expense (income) 396 321 (475)
Pension and postretirement contributions (409) (161) (97)
Equity in earnings of partially-owned affiliates, net of dividends received (144) (153) (86)
Deferred income taxes 327 (329) 273
Non-cash restructuring and impairment charges 183 181 586
Loss (gain) on divestitures - net (1,340) 111 (483)
Fair value adjustment of equity investment — (38) (106)
Equity-based compensation 90 82 64
Other (1) (2) (21)
Changes in assets and liabilities, excluding acquisitions and divestitures:
Receivables (297) (18) (182)
Inventories (99) (311) (97)
Other assets (113) (192) (181)
Restructuring reserves (6) (31) 234
Accounts payable and accrued liabilities 348 440 686
Accrued income taxes 126 197 322
Cash provided by operating activities 1,600 2,395 2,686
Investing Activities
Capital expenditures (1,135) (1,199) (1,377)
Sale of property, plant and equipment 37 79 116
Acquisition of businesses, net of cash acquired (22) (1,733) (123)
Business divestitures 1,646 225 761
Changes in long-term investments (44) 19 (10)
Other (12) 16 53
Cash provided (used) by investing activities 470 (2,593) (580)
Financing Activities
Increase (decrease) in short-term debt - net (68) 73 (197)
Increase in long-term debt 299 2,001 114
Repayment of long-term debt (191) (833) (490)
Stock repurchases (1,362) (1,249) (350)
Payment of cash dividends (657) (568) (513)
Proceeds from the exercise of stock options 275 186 254
Cash paid to acquire a noncontrolling interest (38) (5) (64)
Other (79) (17) 32
Cash used by financing activities (1,821) (412) (1,214)
Effect of exchange rate changes on cash and cash equivalents (81) (20) (98)
Change in cash held for sale 20 (16) (4)
Increase (decrease) in cash and cash equivalents 188 (646) 790
Cash and cash equivalents at beginning of period 409 1,055 265
Cash and cash equivalents at end of period $ 597 $ 409 $ 1,055
The accompanying notes are an integral part of the financial statements.