Johnson Controls 2015 Annual Report Download - page 80
Download and view the complete annual report
Please find page 80 of the 2015 Johnson Controls annual report below. You can navigate through the pages in the report by either clicking on the pages listed below, or by using the keyword search tool below to find specific information within the annual report.-
 1
1 -
2
-
3
-
4
-
5
-
6
-
7
-
8
-
9
-
10
-
11
-
12
-
13
-
14
-
15
-
16
-
17
-
18
-
19
-
20
-
21
-
22
-
23
-
24
-
25
-
26
-
27
-
28
-
29
-
30
-
31
-
32
-
33
-
34
-
35
-
36
-
37
-
38
-
39
-
40
-
41
-
42
-
43
-
44
-
45
-
46
-
47
-
48
-
49
-
50
-
51
-
52
-
53
-
54
-
55
-
56
-
57
-
58
-
59
-
60
-
61
-
62
-
63
-
64
-
65
-
66
-
67
-
68
-
69
-
 70
70 -
 71
71 -
 72
72 -
 73
73 -
 74
74 -
 75
75 -
 76
76 -
 77
77 -
 78
78 -
 79
79 -
 80
80 -
 81
81 -
 82
82 -
 83
83 -
 84
84 -
 85
85 -
 86
86 -
 87
87 -
 88
88 -
 89
89 -
 90
90 -
91
-
92
-
93
-
94
-
95
-
96
-
97
-
98
-
99
-
100
-
101
-
102
-
103
-
104
-
105
-
106
-
107
-
108
-
109
-
110
-
111
-
112
-
113
-
114
-
115
-
116
-
117
-
118
-
119
-
120
-
121
 |
 |

80
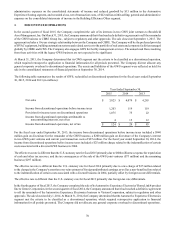
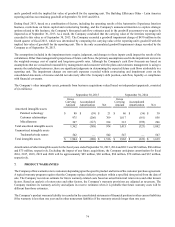
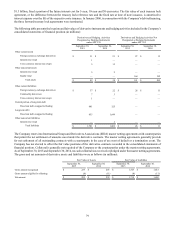
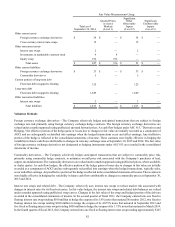
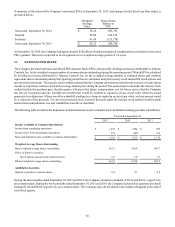
The following tables present the location and amount of the effective portion of gains and losses gross of tax on derivative
instruments and related hedge items reclassified from AOCI into the Company’s consolidated statements of income for the fiscal
years ended September 30, 2015 and 2014 and amounts recorded in AOCI net of tax in the consolidated statements of financial
position (in millions):
Location of Gain (Loss)
Reclassified from AOCI into Income
Amount of Gain (Loss) Reclassified from AOCI into Income
Derivatives in ASC 815 Cash Flow
Hedging Relationships
Year Ended September 30,
2015 2014
Foreign currency exchange derivatives Cost of sales $ 1 $ (2)
Commodity derivatives Cost of sales (11) 1
Forward treasury locks Net financing charges 1 1
Total $ (9) $ —
Derivatives in ASC 815 Cash Flow
Hedging Relationships
Amount of Gain (Loss) Recognized in AOCI on Derivative
September 30, 2015 September 30, 2014
Foreign currency exchange derivatives $ (5) $ —
Commodity derivatives (7) (2)
Forward treasury locks 5 6
Total $ (7) $ 4
Location of Gain (Loss)
Recognized in Income on
Derivative
Amount of Gain (Loss) Recognized in Income on Derivative
Derivatives in ASC 815 Fair Value
Hedging Relationships
Year Ended September 30,
2015 2014 2013
Interest rate swap Net financing charges $ 7 $ 5 $ (2)
Fixed rate debt swapped to floating Net financing charges (7) (5) 2
Total $ — $ — $ —
Location of Gain (Loss)
Recognized in Income on
Derivative
Amount of Gain (Loss) Recognized in Income on Derivative
Derivatives Not Designated as Hedging
Instruments under ASC 815
Year Ended September 30,
2015 2014 2013
Foreign currency exchange derivatives Cost of sales $ (3) $ 1 $ (8)
Foreign currency exchange derivatives Net financing charges (12) 18 25
Foreign currency exchange derivatives Provision for income taxes — — (5)
Equity swap Selling, general and administrative (9) (1) 65
Total $ (24) $ 18 $ 77
The amount of gains recognized in cumulative translation adjustment (CTA) within AOCI on the effective portion of outstanding
net investment hedges was $2 million and $9 million at September 30, 2015 and 2014, respectively. For the years ended
September 30, 2015 and 2014, no gains or losses were reclassified from CTA into income for the Company’s outstanding net
investment hedges, and no gains or losses were recognized in income for the ineffective portion of cash flow hedges.
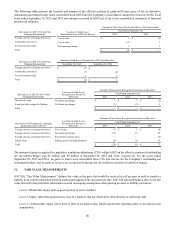
11. FAIR VALUE MEASUREMENTS
ASC 820, "Fair Value Measurement," defines fair value as the price that would be received to sell an asset or paid to transfer a
liability in an orderly transaction between market participants at the measurement date. ASC 820 also establishes a three-level fair
value hierarchy that prioritizes information used in developing assumptions when pricing an asset or liability as follows:
Level 1: Observable inputs such as quoted prices in active markets;
Level 2: Inputs, other than quoted prices in active markets, that are observable either directly or indirectly; and
Level 3: Unobservable inputs where there is little or no market data, which requires the reporting entity to develop its own
assumptions.