Foot Locker 2010 Annual Report Download - page 75
Download and view the complete annual report
Please find page 75 of the 2010 Foot Locker annual report below. You can navigate through the pages in the report by either clicking on the pages listed below, or by using the keyword search tool below to find specific information within the annual report.-
 1
1 -
2
-
3
-
4
-
5
-
6
-
7
-
8
-
9
-
10
-
11
-
12
-
13
-
14
-
15
-
16
-
17
-
18
-
19
-
20
-
21
-
22
-
23
-
24
-
25
-
26
-
27
-
28
-
29
-
30
-
31
-
32
-
33
-
34
-
35
-
36
-
37
-
38
-
39
-
40
-
41
-
42
-
43
-
44
-
45
-
46
-
47
-
48
-
49
-
50
-
51
-
52
-
53
-
54
-
55
-
56
-
57
-
58
-
59
-
60
-
61
-
62
-
63
-
64
-
 65
65 -
 66
66 -
 67
67 -
 68
68 -
 69
69 -
 70
70 -
 71
71 -
 72
72 -
 73
73 -
 74
74 -
 75
75 -
 76
76 -
 77
77 -
 78
78 -
 79
79 -
 80
80 -
 81
81 -
 82
82 -
 83
83 -
 84
84 -
 85
85 -
86
-
87
-
88
-
89
-
90
-
91
-
92
-
93
-
94
-
95
-
96
-
97
-
98
-
99
-
100
-
101
-
102
-
103
-
104
 |
 |

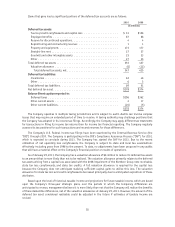
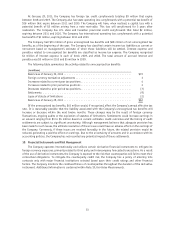
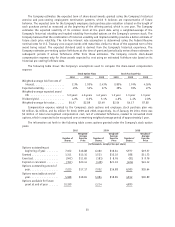
As of January 29, 2011 and January 30, 2010, the Canadian qualified pension plan’s assets exceeded or
equaled its accumulated benefit obligation. Information for pension plans with an accumulated benefit
obligation in excess of plan assets is as follows:
2010 2009
(in millions)
Projected benefit obligation ................................. $581 $569
Accumulated benefit obligation ............................... 581 569
Fair value of plan assets .................................... 511 465
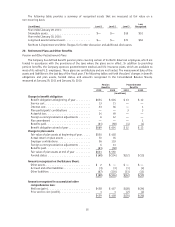
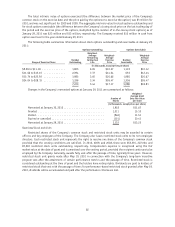
The following tables set forth the changes in accumulated other comprehensive loss (pre-tax) at January 29,
2011:
Pension
Benefits Postretirement
Benefits
(in millions)
Net actuarial loss (gain) at beginning of year .................. $457 $(34)
Amortization of net (loss) gain............................ (17) 6
Gain arising during the year .............................. (6) —
Foreign currency translation adjustments ..................... 4 —
Net actuarial loss (gain) at end of year
(1)
..................... $438 $(28)
Net prior service cost (benefit) at beginning of year .............. $ 1 $ (2)
Amortization of prior service cost
(1)
........................ — —
Loss arising during the year .............................. — —
Net prior service cost (benefit) at end of year .................. $ 1 $ (2)
Total amount recognized................................ $439 $(30)
(1) The amounts in accumulated other comprehensive loss that are expected to be recognized as components of net periodic benefit cost
(income) during the next year are approximately $16 million and $(5) million related to the pension and postretirement plans,
respectively. Additionally, $(1) million is expected to be recognized representing postretirement benefits prior-service costs.
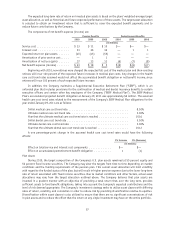
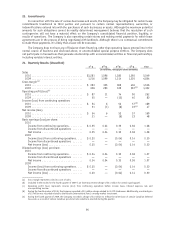
The following weighted-average assumptions were used to determine the benefit obligations under the
plans:
Pension Benefits Postretirement Benefits
2010 2009 2010 2009
Discount rate ........................... 4.98% 5.25% 4.60% 4.90%
Rate of compensation increase ................ 3.68% 3.67%
Pension expense is actuarially calculated annually based on data available at the beginning of each year.
The expected return on plan assets is determined by multiplying the expected long-term rate of return on assets
by the market-related value of plan assets for the U.S. qualified pension plan and market value for the Canadian
qualified pension plan. The market-related value of plan assets is a calculated value that recognizes investment
gains and losses in fair value related to equities over three or five years, depending on which computation results
in a market-related value closer to market value. Market-related value for the U.S. qualified plan was $493 million
and $478 million for 2010 and 2009, respectively. Assumptions used in the calculation of net benefit cost include
the discount rate selected and disclosed at the end of the previous year as well as other assumptions detailed in
the table below:
Pension Benefits Postretirement Benefits
2010 2009 2008 2010 2009 2008
Discount rate .................. 5.25% 6.22% 5.88% 4.90% 6.20% 6.10%
Rate of compensation increase....... 3.68% 3.67% 3.72%
Expected long-term rate of return on
assets ..................... 7.22% 7.63% 8.17%
56