Foot Locker 2010 Annual Report Download - page 30
Download and view the complete annual report
Please find page 30 of the 2010 Foot Locker annual report below. You can navigate through the pages in the report by either clicking on the pages listed below, or by using the keyword search tool below to find specific information within the annual report.-
 1
1 -
2
-
3
-
4
-
5
-
6
-
7
-
8
-
9
-
10
-
11
-
12
-
13
-
14
-
15
-
16
-
17
-
18
-
19
-
 20
20 -
 21
21 -
 22
22 -
 23
23 -
 24
24 -
 25
25 -
 26
26 -
 27
27 -
 28
28 -
 29
29 -
 30
30 -
 31
31 -
 32
32 -
 33
33 -
 34
34 -
 35
35 -
 36
36 -
 37
37 -
 38
38 -
 39
39 -
 40
40 -
41
-
42
-
43
-
44
-
45
-
46
-
47
-
48
-
49
-
50
-
51
-
52
-
53
-
54
-
55
-
56
-
57
-
58
-
59
-
60
-
61
-
62
-
63
-
64
-
65
-
66
-
67
-
68
-
69
-
70
-
71
-
72
-
73
-
74
-
75
-
76
-
77
-
78
-
79
-
80
-
81
-
82
-
83
-
84
-
85
-
86
-
87
-
88
-
89
-
90
-
91
-
92
-
93
-
94
-
95
-
96
-
97
-
98
-
99
-
100
-
101
-
102
-
103
-
104
 |
 |

PART II
Item 5. Market for the Company’s Common Equity, Related Stockholder Matters and Issuer Purchases of
Equity Securities
Foot Locker, Inc. common stock is listed on The New York Stock Exchange as well as on the Börse Stuttgart
stock exchange in Germany. In addition, the stock is traded on the Cincinnati stock exchange. At January 29,
2011, the Company had 19,286 shareholders of record owning 154,620,118 common shares. During each of the
quarters of 2010 and 2009, the Company declared dividends of $0.15 per share. The following table sets forth, for
the period indicated, the intra-day high and low sales prices for the Company’s common stock:
2010 2009
High Low High Low
1
st
Quarter ........................... $16.76 $11.30 $12.29 $7.09
2
nd
Quarter ........................... 15.79 12.27 12.95 9.38
3
rd
Quarter ........................... 16.09 11.59 12.31 9.91
4
th
Quarter ........................... 20.08 15.63 12.55 9.46
The following table provides information with respect to shares of the Company’s common stock that the
Company repurchased during the thirteen weeks ended January 29, 2011.
Date Purchased
Total
Number of
Shares
Purchased
Average
Price Paid
per Share
Total Number of
Shares Purchased
as Part of Publicly
Announced
Program
(1)
Approximate
Dollar Value of
Shares that may
yet be Purchased
Under the
Program
(1)
Oct. 31, 2010 through Nov. 27, 2010 ...... — $ — — $214,406,176
Nov. 28, 2010 through Jan. 1, 2011 ...... 615,000 19.38 615,000 $202,484,858
Jan. 2, 2011 through Jan. 29, 2011 ...... 90,000 19.75 90,000 $200,707,001
705,000 $19.43 705,000
(1) On February 16, 2010, the Company’s Board of Directors approved the extension of the Company’s 2007 common share repurchase
program for an additional three years in the amount of $250 million. During 2010, the Company repurchased 3,215,000 shares of
common stock at a cost of approximately $50 million. The Company repurchased 705,000 shares of common stock during the fourth
quarter at a cost of approximately $14 million.
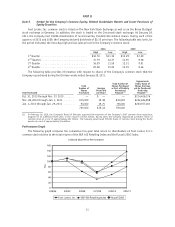
Performance Graph
The following graph compares the cumulative five-year total return to shareholders on Foot Locker, Inc.’s
common stock relative to the total returns of the S&P 400 Retailing Index and the Russell 2000 Index.
Indexed Share Price Performance
0
20
40
60
80
100
120
140
160
1/28/06 2/3/07 2/2/08 1/31/09 1/30/10 1/29/11
(%)
Foot Locker, Inc. S&P 400 Retailing Index Russell 2000
11