Foot Locker 2010 Annual Report Download - page 43
Download and view the complete annual report
Please find page 43 of the 2010 Foot Locker annual report below. You can navigate through the pages in the report by either clicking on the pages listed below, or by using the keyword search tool below to find specific information within the annual report.-
 1
1 -
2
-
3
-
4
-
5
-
6
-
7
-
8
-
9
-
10
-
11
-
12
-
13
-
14
-
15
-
16
-
17
-
18
-
19
-
20
-
21
-
22
-
23
-
24
-
25
-
26
-
27
-
28
-
29
-
30
-
31
-
32
-
 33
33 -
 34
34 -
 35
35 -
 36
36 -
 37
37 -
 38
38 -
 39
39 -
 40
40 -
 41
41 -
 42
42 -
 43
43 -
 44
44 -
 45
45 -
 46
46 -
 47
47 -
 48
48 -
 49
49 -
 50
50 -
 51
51 -
 52
52 -
 53
53 -
54
-
55
-
56
-
57
-
58
-
59
-
60
-
61
-
62
-
63
-
64
-
65
-
66
-
67
-
68
-
69
-
70
-
71
-
72
-
73
-
74
-
75
-
76
-
77
-
78
-
79
-
80
-
81
-
82
-
83
-
84
-
85
-
86
-
87
-
88
-
89
-
90
-
91
-
92
-
93
-
94
-
95
-
96
-
97
-
98
-
99
-
100
-
101
-
102
-
103
-
104
 |
 |

Capital Structure
Credit Agreement
On March 20, 2009, the Company entered into a new credit agreement (the ‘‘2009 Credit Agreement’’) with its
banks, providing for a $200 million asset-based revolving credit facility maturing on March 20, 2013. The 2009
Credit Agreement also provides for an incremental facility of up to $100 million under certain circumstances. The
2009 Credit Agreement provides for a security interest in certain of the Company’s domestic assets, including
certain inventory assets. The Company is not required to comply with any financial covenants as long as there are
no outstanding borrowings. If the Company is borrowing, then it may not make Restricted Payments, such as
dividends or share repurchases, unless there is at least $50 million of Excess Availability (as defined in the 2009
Credit Agreement), and the Company’s projected fixed charge coverage ratio, which is a Non-GAAP financial ratio
determined pursuant to the 2009 Credit Agreement designed as a measure of the Company’s ability to meet
current and future obligations (Consolidated EBITDA less capital expenditures less cash taxes divided by Debt
Service Charges and Restricted Payments), is at least 1.1 to 1.0. The Company’s management does not currently
expect to borrow under the facility in 2011.
Credit Rating
As of March 28, 2011, the Company’s corporate credit ratings from Standard & Poor’s and Moody’s Investors
Service are BB- and Ba3, respectively. Additionally, Moody’s Investors Service has rated the Company’s senior
unsecured notes B1.
Debt Capitalization and Equity
For purposes of calculating debt to total capitalization, the Company includes the present value of operating
lease commitments in total net debt. Total net debt including the present value of operating leases is considered
a non-GAAP financial measure. The present value of operating leases is discounted using various interest rates
ranging from 4 percent to 15 percent, which represent the Company’s incremental borrowing rate at inception of
the lease. Operating leases are the primary financing vehicle used to fund store expansion and, therefore, we
believe that the inclusion of the present value of operating leases in total debt is useful to our investors, credit
constituencies, and rating agencies.
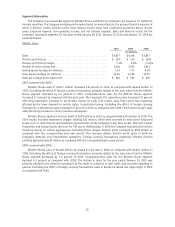
The following table sets forth the components of the Company’s capitalization, both with and without the
present value of operating leases:
2010 2009
(in millions)
Long-term debt ......................................... $ 137 $ 138
Present value of operating leases ............................. 1,852 1,923
Total debt including the present value of operating leases ........... 1,989 2,061
Less:
Cash and cash equivalents .................................. 696 582
Short-term investments ................................... — 7
Total net debt including the present value of operating leases ........ 1,293 1,472
Shareholders’ equity ..................................... 2,025 1,948
Total capitalization ...................................... $3,318 $3,420
Total net debt capitalization percent .......................... —% —%
Total net debt capitalization percent including the present value of
operating leases ...................................... 39.0% 43.0%
The Company increased cash, cash equivalents, and short-term investments by $107 million during 2010
reflecting strong cash flow generation from operating activities. Additionally, the present value of the operating
leases decreased by $71 million as compared with the prior year. This decrease represents the effect of the store
closures, offset, in part, by lease renewals and the effect of foreign currency translation. Including the present
value of operating leases, the Company’s net debt capitalization percent decreased 400 basis points in 2010.
24