Foot Locker 2010 Annual Report Download - page 36
Download and view the complete annual report
Please find page 36 of the 2010 Foot Locker annual report below. You can navigate through the pages in the report by either clicking on the pages listed below, or by using the keyword search tool below to find specific information within the annual report.-
 1
1 -
2
-
3
-
4
-
5
-
6
-
7
-
8
-
9
-
10
-
11
-
12
-
13
-
14
-
15
-
16
-
17
-
18
-
19
-
20
-
21
-
22
-
23
-
24
-
25
-
 26
26 -
 27
27 -
 28
28 -
 29
29 -
 30
30 -
 31
31 -
 32
32 -
 33
33 -
 34
34 -
 35
35 -
 36
36 -
 37
37 -
 38
38 -
 39
39 -
 40
40 -
 41
41 -
 42
42 -
 43
43 -
 44
44 -
 45
45 -
 46
46 -
47
-
48
-
49
-
50
-
51
-
52
-
53
-
54
-
55
-
56
-
57
-
58
-
59
-
60
-
61
-
62
-
63
-
64
-
65
-
66
-
67
-
68
-
69
-
70
-
71
-
72
-
73
-
74
-
75
-
76
-
77
-
78
-
79
-
80
-
81
-
82
-
83
-
84
-
85
-
86
-
87
-
88
-
89
-
90
-
91
-
92
-
93
-
94
-
95
-
96
-
97
-
98
-
99
-
100
-
101
-
102
-
103
-
104
 |
 |

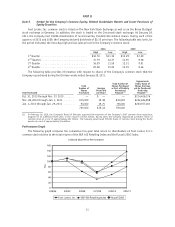
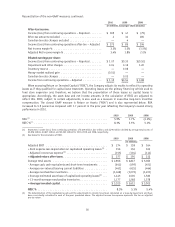
The following table represents a summary of sales and operating results, reconciled to income (loss) from
continuing operations before income taxes.
2010 2009 2008
(in millions)
Sales
Athletic Stores ....................................... $4,617 $4,448 $4,847
Direct-to-Customers .................................... 432 406 390
$5,049 $4,854 $5,237
Operating Results
Athletic Stores
(1)
...................................... $ 329 $ 114 $ (59)
Direct-to-Customers
(2)
.................................. 30 32 43
359 146 (16)
Restructuring income
(3)
.................................. — 1 —
Division profit (loss) ................................... 359 147 (16)
Less: Corporate expense
(4)
................................ 97 67 87
Operating profit (loss) .................................. 262 80 (103)
Other income
(5)
....................................... 4 3 8
Earnings before interest expense and income taxes ............... 266 83 (95)
Interest expense, net ................................... 9 10 5
Income (loss) from continuing operations before income taxes ....... $ 257 $ 73 $(100)
(1) The year ended January 30, 2010 includes non-cash impairment charges totaling $32 million, which were recorded to write-down
long-lived assets such as store fixtures and leasehold improvements at the Company’s Lady Foot Locker, Kids Foot Locker, Footaction,
and Champs Sports divisions. The year ended January 31, 2009 includes a $241 million charge representing long-lived store asset
impairment, goodwill and other intangibles impairment, and store closing costs related to the Company’s U.S. operations.
(2) Included in the results for the year ended January 29, 2011 is a non-cash impairment charge of $10 million to write-down the CCS
tradename intangible asset. Included in the results for the year ended January 30, 2010 is a non-cash impairment charge of $4 million
to write off software development costs.
(3) During the year ended January 30, 2010, the Company adjusted its 1999 restructuring reserves to reflect a favorable lease termination.
(4) During the fourth quarter of 2009, the Company restructured its organization by consolidating the Lady Foot Locker, Foot Locker U.S.,
Kids Foot Locker, and Footaction businesses in addition to reducing corporate staff, resulting in a $5 million charge. Included in
corporate expense for the year ended January 31, 2009 is a $3 million other-than-temporary impairment charge related to the
investment in the Reserve International Liquidity Fund. Additionally, for the year ended January 31, 2009 the Company recorded a $15
million impairment charge on the Northern Group note receivable.
(5) Other income includes non-operating items, such as gains from insurance recoveries, gains on the repurchase and retirement of bonds,
royalty income, the changes in fair value, premiums paid and realized gains associated with foreign currency option contracts. Included
in the year ended January 29, 2011 is a $2 million gain to reflect the Company’s settlement of its investment in the Reserve
International Liquidity Fund.
Sales
All references to comparable-store sales for a given period relate to sales from stores that are open at the
period-end, that have been open for more than one year, and exclude the effect of foreign currency fluctuations.
Accordingly, stores opened and closed during the period are not included. Sales from the Direct-to-Customers
segment are included in the calculation of comparable-store sales for all periods presented. Sales from acquired
businesses that include the purchase of inventory are included in the computation of comparable-store sales
after 15 months of operations. Accordingly, effective with the first quarter of 2010, CCS internet and catalog sales
have been included in the computation of comparable-store sales.
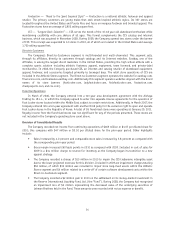
Sales increased to $5,049 million, or by 4.0 percent as compared with 2009. Excluding the effect of foreign
currency fluctuations, sales increased 4.6 percent as compared with 2009. Comparable-store sales increased by
5.8 percent.
Sales of $4,854 million in 2009 decreased by 7.3 percent from sales of $5,237 million in 2008. Excluding the
effect of foreign currency fluctuations, sales declined 6.1 percent as compared with 2008. Comparable-store sales
decreased by 6.3 percent.
17