Foot Locker 2010 Annual Report Download - page 2
Download and view the complete annual report
Please find page 2 of the 2010 Foot Locker annual report below. You can navigate through the pages in the report by either clicking on the pages listed below, or by using the keyword search tool below to find specific information within the annual report.
This report contains forward-looking statements within the meaning of the federal securities laws. All statements, other than statements of historical facts, that
address activities, events or developments that the Company expects or anticipates will or may occur in the future, including, but not limited to, such things
as future capital expenditures, expansion, strategic plans, financial objectives, dividend payments, stock repurchases, growth of the Company’s business and
operations, including future cash flows, revenues and earnings, and other such matters are forward-looking statements. These forward-looking statements are
based on many assumptions and factors detailed in the Company’s filings with the Securities and Exchange Commission, including the Annual Report on Form
10-K for the 2010 fiscal year. Any changes in such assumptions or factors could produce significantly different results. The Company undertakes no obligation to
update forward-looking statements, whether as a result of new information, future events, or otherwise.
Financial Highlights, Store Summary ....................... 1
About the Company ................................................ 2
Letter to Shareholders ............................................. 3
Our Vision ................................................................. 5
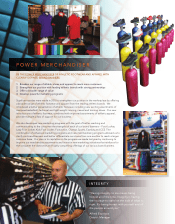
Power Merchandiser ................................................ 7
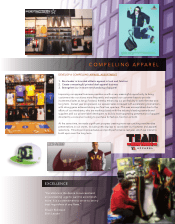
Compelling Apparel ................................................. 8
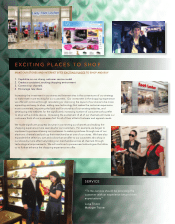
Exciting Places to Shop ........................................... 9
Growth Opportunities ............................................. 10
Increased Productivity ............................................. 11
Retail Leaders ........................................................... 12
Community Outreach ............................................... 13
Board of Directors, Corporate Management,
Division Management, Corporate Information ....... 14
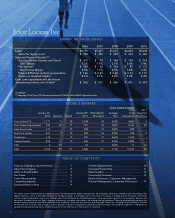
STORE SUMMARY
Gross Square Footage
2010 2011
January 30, January 29, Remodeled/ Average Total Targeted
2010 Opened Closed 2011 Relocated Size (thousands) Openings
Foot Locker U.S. 1,171 5 32 1,144 54 4,000 4,600 5
Foot Locker International 740 22 11 751 50 2,900 2,167 40
Lady Foot Locker 415 - 37 378 15 2,200 838 -
Kids Foot Locker 301 5 12 294 16 2,400 706 5
Footaction 319 - 12 307 15 4,600 1,413 -
Champs Sports 552 1 13 540 21 5,300 2,880 -
CCS 2 10 - 12 - 2,600 31 10
Total 3,500 43 117 3,426 171 3,700 12,635 60
TABLE OF CONTENTS
FINANCIAL HIGHLIGHTS
2006 2007 2008 2009 2010
Sales* $ 5,750 $ 5,437 $ 5,237 $ 4,854 $ 5,049
Sales Per Square Foot $ 372 $ 352 $ 350 $ 333 $ 360
Adjusted Financial Results:**
Earnings Before Interest and Taxes* $ 412 $ 79 $ 164 $ 138 $ 274
EBIT Margin 7.2% 1.5% 3.1% 2.8% 5.4%
Net Income* $ 259 $ 62 $ 106 $ 85 $ 173
Net Income Margin 4.5% 1.1% 2.0% 1.8% 3.4%
Diluted EPS from continuing operations $ 1.66 $ 0.40 $ 0.68 $ 0.54 $ 1.10
Return on Invested Capital 9.1% 4.1% 5.4% 5.3% 8.3%
Cash, cash equivalents and short-term
investment position, net of debt* $ 236 $ 272 $ 266 $ 451 $ 559
* In Millions
** See page 15 of Form 10-K for reconciliation of GAAP to non-GAAP adjusted results
1


