Foot Locker 2010 Annual Report Download - page 40
Download and view the complete annual report
Please find page 40 of the 2010 Foot Locker annual report below. You can navigate through the pages in the report by either clicking on the pages listed below, or by using the keyword search tool below to find specific information within the annual report.-
 1
1 -
2
-
3
-
4
-
5
-
6
-
7
-
8
-
9
-
10
-
11
-
12
-
13
-
14
-
15
-
16
-
17
-
18
-
19
-
20
-
21
-
22
-
23
-
24
-
25
-
26
-
27
-
28
-
29
-
 30
30 -
 31
31 -
 32
32 -
 33
33 -
 34
34 -
 35
35 -
 36
36 -
 37
37 -
 38
38 -
 39
39 -
 40
40 -
 41
41 -
 42
42 -
 43
43 -
 44
44 -
 45
45 -
 46
46 -
 47
47 -
 48
48 -
 49
49 -
 50
50 -
51
-
52
-
53
-
54
-
55
-
56
-
57
-
58
-
59
-
60
-
61
-
62
-
63
-
64
-
65
-
66
-
67
-
68
-
69
-
70
-
71
-
72
-
73
-
74
-
75
-
76
-
77
-
78
-
79
-
80
-
81
-
82
-
83
-
84
-
85
-
86
-
87
-
88
-
89
-
90
-
91
-
92
-
93
-
94
-
95
-
96
-
97
-
98
-
99
-
100
-
101
-
102
-
103
-
104
 |
 |

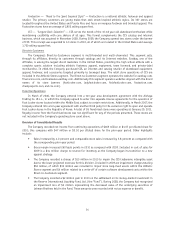
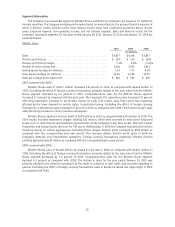
Athletic Stores reported a division profit of $114 million in 2009 as compared with a loss of $59 million in
2008. Included in the results are impairment and other charges of $46 million and $241 million in 2009 and 2008,
respectively. The 2009 results included impairment charges totaling $32 million and a $14 million inventory
reserve on certain aged apparel. The 2008 results included a $241 million charge representing long-lived store
asset impairment, goodwill and other intangibles impairment, and store closing costs related to the Company’s
U.S. operations. Excluding these charges, division profit decreased $22 million in 2009 as compared with the
corresponding prior-year period, which relates primarily to the domestic businesses. Excluding the effect of
foreign currency fluctuations, division profit of international operations was essentially flat as compared with the
corresponding prior-year period.
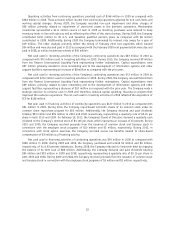
Direct-to-Customers
2010 2009 2008
(in millions)
Sales .............................................. $432 $406 $ 390
Division profit ........................................ $ 30 $ 32 $ 43
Division profit margin ................................... 6.9% 7.9% 11.0%
2010 compared with 2009
Direct-to-Customers sales increased 6.4 percent to $432 million in 2010, as compared with $406 million in
2009. Effective with the first quarter of 2010, CCS internet and catalog sales have been included in the
computation of comparable-store sales. Internet sales increased by 9.0 percent to $375 million, as compared with
2009 reflecting a strong sales performance through the Company’s store banner websites, which benefited from
improved functionality and more compelling product assortments. Catalog sales decreased by 8.1 percent to
$57 million in 2010 from $62 million in 2009. Management believes that the decrease in catalog sales is the
result of the continuing trend of customers browsing and selecting products through its catalogs and then
making their purchases via the Internet.
The Direct-to-Customers business generated division profit of $30 million in 2010, as compared with
$32 million in 2009. Division profit, as a percentage of sales, was 6.9 percent in 2010 and 7.9 percent in 2009.
Included in the 2010 division profit is a $10 million impairment charge, which was recorded to write down CCS
intangible assets, specifically the non-amortizing tradename. The impairment was primarily the result of reduced
revenue projections. Included in 2009 division profit is a $4 million impairment charge, which was recorded to
write off certain software development costs as a result of management’s decision to terminate the project.
Excluding these charges, division profit increased by $4 million as compared with the prior year.
2009 compared with 2008
Direct-to-Customers sales increased 4.1 percent to $406 million in 2009, as compared with $390 million in
2008, reflecting a comparable-store sales decrease of 6.8 percent, offset by additional sales from CCS, which was
acquired during the fourth quarter of 2008. Internet sales increased by 6.8 percent to $344 million, as compared
with 2008 reflecting continued growth in the store brands’ websites. Catalog sales decreased by 8.8 percent to
$62 million in 2009 from $68 million in 2008.
The Direct-to-Customers business generated division profit of $32 million in 2009, as compared with
$43 million in 2008. Division profit, as a percentage of sales, was 7.9 percent in 2009 and 11.0 percent in 2008.
Included in division profit is a $4 million impairment charge, which was recorded to write off certain software
development costs as a result of management’s decision to terminate the project. Gross margin was negatively
affected by the lack of close-out inventory purchases during the year. Additionally, division profit, as compared
with the corresponding prior-year period, was negatively affected by $3 million in additional amortization
expense related to the CCS customer list intangible asset.
21