Foot Locker 2010 Annual Report Download - page 34
Download and view the complete annual report
Please find page 34 of the 2010 Foot Locker annual report below. You can navigate through the pages in the report by either clicking on the pages listed below, or by using the keyword search tool below to find specific information within the annual report.-
 1
1 -
2
-
3
-
4
-
5
-
6
-
7
-
8
-
9
-
10
-
11
-
12
-
13
-
14
-
15
-
16
-
17
-
18
-
19
-
20
-
21
-
22
-
23
-
 24
24 -
 25
25 -
 26
26 -
 27
27 -
 28
28 -
 29
29 -
 30
30 -
 31
31 -
 32
32 -
 33
33 -
 34
34 -
 35
35 -
 36
36 -
 37
37 -
 38
38 -
 39
39 -
 40
40 -
 41
41 -
 42
42 -
 43
43 -
 44
44 -
45
-
46
-
47
-
48
-
49
-
50
-
51
-
52
-
53
-
54
-
55
-
56
-
57
-
58
-
59
-
60
-
61
-
62
-
63
-
64
-
65
-
66
-
67
-
68
-
69
-
70
-
71
-
72
-
73
-
74
-
75
-
76
-
77
-
78
-
79
-
80
-
81
-
82
-
83
-
84
-
85
-
86
-
87
-
88
-
89
-
90
-
91
-
92
-
93
-
94
-
95
-
96
-
97
-
98
-
99
-
100
-
101
-
102
-
103
-
104
 |
 |

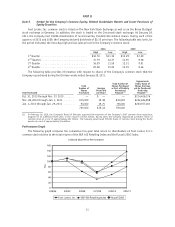
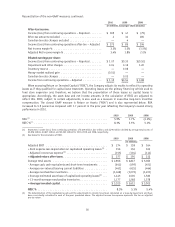
Other highlights include:
• Cash and cash equivalents at January 29, 2011 were $696 million, representing an increase of
$114 million.
• Cash flow provided from operations was $326 million, which included the payment on the settlement of
the net investment hedge of $24 million and qualified pension contribution totaling $32 million. The
funded status of the qualified plans improved to 93 percent as compared with 87 percent in 2009.
• Dividends totaling $93 million were declared and paid. Effective with the first quarter 2011 dividend
payment, the dividend was increased by 10 percent to $0.165 per share.
In March 2010, the Company announced a new strategic plan, which includes a series of operating initiatives
and long-term financial objectives. We consider the following financial objectives in assessing our performance
pursuant to the strategic plan:
• Sales of $6 billion
• Sales per gross square foot of $400
• EBIT margin of 8 percent
• Net income margin of 5 percent
• Return on Invested Capital of 10 percent
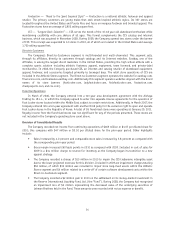
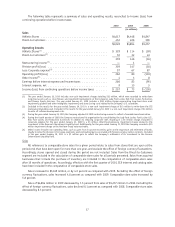
In the following tables, the Company has presented certain financial measures and ratios identified as
non-GAAP. The Company believes this non-GAAP information is a useful measure to investors because it allows
for a more direct comparison of the Company’s performance for 2010 as compared with 2009 and is useful in
assessing the Company’s progress in achieving its long-term financial objectives noted above. The following
represents a reconciliation of the non-GAAP measures: 2010 2009 2008
(in millions)
Pre-tax income:
Income (loss) from continuing operations before income
taxes − Reported ............................. $257 $ 73 $(100)
Pre-tax amounts excluded from GAAP
Impairment of goodwill and other intangible assets ....... 10 — 169
Impairment of assets ........................... — 36 67
Reorganization costs ........................... — 5 —
Store closing program .......................... — — 5
Money market impairment ....................... — — 3
Northern Group note impairment ................... — — 15
Impairment and other charges ..................... 10 41 259
Inventory reserve − recorded within cost of sales ........ — 14 —
Money market realized gain − recorded within other income . (2) — —
Total pre-tax amounts excluded ..................... $ 8 $ 55 $259
Income (loss) from continuing operations before income
taxes − Adjusted .............................. $265 $128 $ 159
Calculation of EBIT:
Income (loss) from continuing operations before income
taxes − Reported ............................. $257 $ 73 $(100)
Interest expense, net ............................ 9 10 5
EBIT ....................................... $266 $ 83 $ (95)
EBIT margin % ................................. 5.3% 1.7% (1.8%)
Income (loss) from continuing operations before income
taxes − Adjusted .............................. $265 $128 $ 159
Interest expense, net ............................ 9 10 5
Adjusted EBIT ................................. $274 $138 $ 164
Adjusted EBIT margin % .......................... 5.4% 2.8% 3.1%
15