Foot Locker 2010 Annual Report Download - page 39
Download and view the complete annual report
Please find page 39 of the 2010 Foot Locker annual report below. You can navigate through the pages in the report by either clicking on the pages listed below, or by using the keyword search tool below to find specific information within the annual report.-
 1
1 -
2
-
3
-
4
-
5
-
6
-
7
-
8
-
9
-
10
-
11
-
12
-
13
-
14
-
15
-
16
-
17
-
18
-
19
-
20
-
21
-
22
-
23
-
24
-
25
-
26
-
27
-
28
-
 29
29 -
 30
30 -
 31
31 -
 32
32 -
 33
33 -
 34
34 -
 35
35 -
 36
36 -
 37
37 -
 38
38 -
 39
39 -
 40
40 -
 41
41 -
 42
42 -
 43
43 -
 44
44 -
 45
45 -
 46
46 -
 47
47 -
 48
48 -
 49
49 -
50
-
51
-
52
-
53
-
54
-
55
-
56
-
57
-
58
-
59
-
60
-
61
-
62
-
63
-
64
-
65
-
66
-
67
-
68
-
69
-
70
-
71
-
72
-
73
-
74
-
75
-
76
-
77
-
78
-
79
-
80
-
81
-
82
-
83
-
84
-
85
-
86
-
87
-
88
-
89
-
90
-
91
-
92
-
93
-
94
-
95
-
96
-
97
-
98
-
99
-
100
-
101
-
102
-
103
-
104
 |
 |

Segment Information
The Company’s two reportable segments, Athletic Stores and Direct-to-Customers, are based on its method of
internal reporting. The Company evaluates performance based on several factors, the primary financial measure of
which is division results. Division profit (loss) reflects income (loss) from continuing operations before income
taxes, corporate expense, non-operating income, and net interest expense. Sales and division results for the
Company’s reportable segments for the years ended January 29, 2011, January 30, 2010, and January 31, 2009 are
presented below.
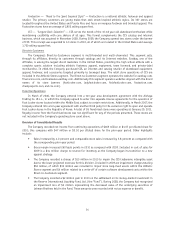
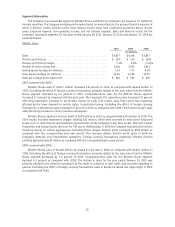
Athletic Stores
2010 2009 2008
(in millions)
Sales .............................................. $4,617 $4,448 $4,847
Division profit (loss) ................................... $ 329 $ 114 $ (59)
Division profit (loss) margin .............................. 7.1% 2.6% (1.2)%
Number of stores at year end .............................. 3,426 3,500 3,641
Selling square footage (in millions) .......................... 7.54 7.74 8.09
Gross square footage (in millions) ........................... 12.64 12.96 13.50
Sales per average gross square foot .......................... $ 360 $ 333 $ 350
2010 compared with 2009
Athletic Stores sales of $4,617 million increased 3.8 percent in 2010, as compared with $4,448 million in
2009. Excluding the effect of foreign currency fluctuations, primarily related to the euro, sales from the Athletic
Stores segment increased by 4.4 percent in 2010. Comparable-store sales for the Athletic Stores segment
increased 5.7 percent as compared with the prior year. The Company’s U.S. operations sales increased 3.9 percent
reflecting meaningful increases in all formats, except for Lady Foot Locker. Lady Foot Locker was negatively
affected by the lower demand for certain styles, in particular toning. Excluding the effect of foreign currency
fluctuations, international sales increased 5.5 percent in 2010 as compared with 2009. Foot Locker Europe’s sales
reflected strong increases in men’s footwear and apparel.
Athletic Stores reported a division profit of $329 million in 2010 as compared with $114 million in 2009. The
2009 results included impairment charges totaling $32 million, which were recorded to write down long-lived
assets such as store fixtures and leasehold improvements at the Company’s Lady Foot Locker, Kids Foot Locker,
Footaction, and Champs Sports divisions for 787 stores. Additionally, in 2009 the Company recorded a $14 million
inventory reserve on certain aged apparel. Excluding these charges, division profit increased by $169 million as
compared with the corresponding prior-year period. This increase reflects division profit gains in both the
Company’s domestic and international operations. Foreign currency fluctuations negatively affected division
profit by approximately $4 million as compared with the corresponding prior-year period.
2009 compared with 2008
Athletic Stores sales of $4,448 million decreased 8.2 percent in 2009, as compared with $4,847 million in
2008. Excluding the effect of foreign currency fluctuations, primarily related to the euro, sales from the Athletic
Stores segment decreased by 7.0 percent in 2009. Comparable-store sales for the Athletic Stores segment
declined 6.2 percent as compared with 2008. The decline in sales for the year ended January 30, 2010 was
primarily related to the domestic operations as the result of a decline in mall traffic and consumer spending in
general. Excluding the effect of foreign currency fluctuations, sales in Europe increased low single digits in 2009
as compared with 2008.
20