Foot Locker 2010 Annual Report Download - page 35
Download and view the complete annual report
Please find page 35 of the 2010 Foot Locker annual report below. You can navigate through the pages in the report by either clicking on the pages listed below, or by using the keyword search tool below to find specific information within the annual report.-
 1
1 -
2
-
3
-
4
-
5
-
6
-
7
-
8
-
9
-
10
-
11
-
12
-
13
-
14
-
15
-
16
-
17
-
18
-
19
-
20
-
21
-
22
-
23
-
24
-
 25
25 -
 26
26 -
 27
27 -
 28
28 -
 29
29 -
 30
30 -
 31
31 -
 32
32 -
 33
33 -
 34
34 -
 35
35 -
 36
36 -
 37
37 -
 38
38 -
 39
39 -
 40
40 -
 41
41 -
 42
42 -
 43
43 -
 44
44 -
 45
45 -
46
-
47
-
48
-
49
-
50
-
51
-
52
-
53
-
54
-
55
-
56
-
57
-
58
-
59
-
60
-
61
-
62
-
63
-
64
-
65
-
66
-
67
-
68
-
69
-
70
-
71
-
72
-
73
-
74
-
75
-
76
-
77
-
78
-
79
-
80
-
81
-
82
-
83
-
84
-
85
-
86
-
87
-
88
-
89
-
90
-
91
-
92
-
93
-
94
-
95
-
96
-
97
-
98
-
99
-
100
-
101
-
102
-
103
-
104
 |
 |

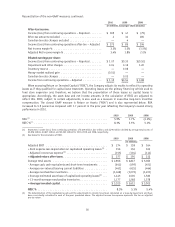
Reconciliation of the non-GAAP measures, continued:
2010 2009 2008
(in millions, except per share amounts)
After-tax income:
Income (loss) from continuing operations − Reported ....... $ 169 $ 47 $ (79)
After-tax amounts excluded ........................ 4 34 185
Canadian tax rate changes excluded ................... — 4 —
Income (loss) from continuing operations after-tax − Adjusted $ 173 $ 85 $ 106
Net income margin % ............................ 3.3% 1.0% (1.5%)
Adjusted Net income margin % ...................... 3.4% 1.8% 2.0%
Diluted earnings per share:
Income (loss) from continuing operations − Reported ....... $1.07 $0.30 $(0.52)
Impairment and other charges ...................... 0.04 0.16 1.20
Inventory reserve ............................... — 0.06 —
Money-market realized gain ........................ (0.01) — —
Canadian tax rate changes ......................... — 0.02 —
Income from continuing operations − Adjusted ........... $1.10 $0.54 $ 0.68
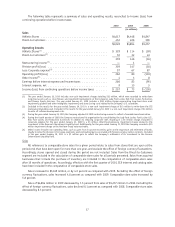
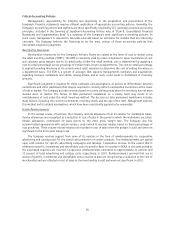
When assessing Return on Invested Capital (‘‘ROIC’’), the Company adjusts its results to reflect its operating
leases as if they qualified for capital lease treatment. Operating leases are the primary financing vehicle used to
fund store expansion and, therefore, we believe that the presentation of these leases as capital leases is
appropriate. Accordingly, the asset base and net income amounts in the calculation of ROIC are adjusted to
reflect this. ROIC, subject to certain adjustments, is also used as a measure in executive long-term incentive
compensation. The closest GAAP measure is Return on Assets (‘‘ROA’’) and is also represented below. ROA
increased to 5.9 percent as compared with 1.7 percent in the prior year reflecting the Company’s overall strong
performance in 2010.
2010 2009 2008
ROA
(1)
............................................. 5.9% 1.7% (2.6%)
ROIC %
(2)
........................................... 8.3% 5.3% 5.4%
(1) Represents income (loss) from continuing operations of $169 million, $47 million, and $(79) million divided by average total assets of
$2,856 million, $2,847 million, and $3,060 million for 2010, 2009, and 2008, respectively.
(2) See below for the calculation of ROIC.
2010 2009 2008
(in millions)
Adjusted EBIT .................................... $ 274 $ 138 $ 164
+ Rent expense less depreciation on capitalized operating leases
(3)
. 156 156 162
- Adjusted income tax expense
(3)
........................ (153) (104) (114)
= Adjusted return after taxes .......................... $ 277 $ 190 $ 212
Average total assets ................................ $2,856 $ 2,847 $ 3,060
- Average cash, cash equivalents and short-term investments ..... (642) (499) (451)
- Average non-interest bearing current liabilities ............. (461) (425) (464)
- Average merchandise inventories ....................... (1,048) (1,079) (1,201)
+ Average estimated asset base of capitalized operating leases
(3)
. . . 1,443 1,500 1,580
+ 13-month average merchandise inventories ................ 1,177 1,268 1,378
= Average invested capital............................ $3,325 $ 3,612 $ 3,902
ROIC % ......................................... 8.3% 5.3% 5.4%
(3) The determination of the capitalized assets and the adjustments to income have been calculated on a lease-by-lease basis and have
been consistently calculated in each of the years presented above. The adjusted income tax expense represents the tax on adjusted
pre-tax return.
16