Foot Locker 2010 Annual Report Download - page 7
Download and view the complete annual report
Please find page 7 of the 2010 Foot Locker annual report below. You can navigate through the pages in the report by either clicking on the pages listed below, or by using the keyword search tool below to find specific information within the annual report.-
 1
1 -
 2
2 -
 3
3 -
 4
4 -
 5
5 -
 6
6 -
 7
7 -
 8
8 -
 9
9 -
 10
10 -
 11
11 -
 12
12 -
 13
13 -
 14
14 -
 15
15 -
 16
16 -
 17
17 -
 18
18 -
19
-
20
-
21
-
22
-
23
-
24
-
25
-
26
-
27
-
28
-
29
-
30
-
31
-
32
-
33
-
34
-
35
-
36
-
37
-
38
-
39
-
40
-
41
-
42
-
43
-
44
-
45
-
46
-
47
-
48
-
49
-
50
-
51
-
52
-
53
-
54
-
55
-
56
-
57
-
58
-
59
-
60
-
61
-
62
-
63
-
64
-
65
-
66
-
67
-
68
-
69
-
70
-
71
-
72
-
73
-
74
-
75
-
76
-
77
-
78
-
79
-
80
-
81
-
82
-
83
-
84
-
85
-
86
-
87
-
88
-
89
-
90
-
91
-
92
-
93
-
94
-
95
-
96
-
97
-
98
-
99
-
100
-
101
-
102
-
103
-
104
 |
 |

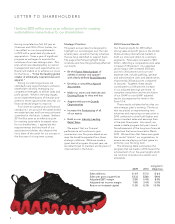
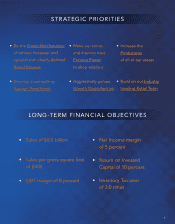
• Sales of $6.0 billion
• Sales per gross square foot
of $400
• EBIT margin of 8 percent
• Net Income margin
of 5 percent
• Return on Invested
Capital of 10 percent
• Inventory Turnover
of 3.0 times
STRATEGIC PRIORITIES
LONG-TERM FINANCIAL OBJECTIVES
• Be the Power Merchandiser
of athletic footwear and
apparel with clearly-defined
Brand Banners
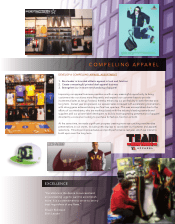
• Develop a compelling
Apparel Assortment
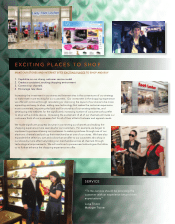
• Make our stores
and Internet sites
Exciting Places
to shop and buy
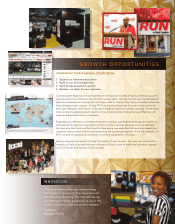
• Aggressively pursue
Growth Opportunities
• Increase the
Productivity
of all of our assets
• Build on our Industry
Leading Retail Team
6