Foot Locker 2010 Annual Report Download - page 72
Download and view the complete annual report
Please find page 72 of the 2010 Foot Locker annual report below. You can navigate through the pages in the report by either clicking on the pages listed below, or by using the keyword search tool below to find specific information within the annual report.-
 1
1 -
2
-
3
-
4
-
5
-
6
-
7
-
8
-
9
-
10
-
11
-
12
-
13
-
14
-
15
-
16
-
17
-
18
-
19
-
20
-
21
-
22
-
23
-
24
-
25
-
26
-
27
-
28
-
29
-
30
-
31
-
32
-
33
-
34
-
35
-
36
-
37
-
38
-
39
-
40
-
41
-
42
-
43
-
44
-
45
-
46
-
47
-
48
-
49
-
50
-
51
-
52
-
53
-
54
-
55
-
56
-
57
-
58
-
59
-
60
-
61
-
 62
62 -
 63
63 -
 64
64 -
 65
65 -
 66
66 -
 67
67 -
 68
68 -
 69
69 -
 70
70 -
 71
71 -
 72
72 -
 73
73 -
 74
74 -
 75
75 -
 76
76 -
 77
77 -
 78
78 -
 79
79 -
 80
80 -
 81
81 -
 82
82 -
83
-
84
-
85
-
86
-
87
-
88
-
89
-
90
-
91
-
92
-
93
-
94
-
95
-
96
-
97
-
98
-
99
-
100
-
101
-
102
-
103
-
104
 |
 |

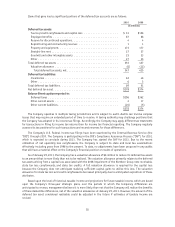
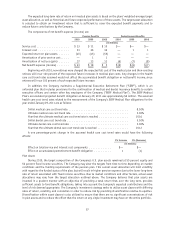
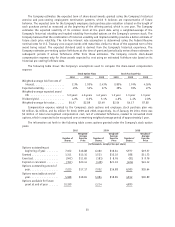
Fair Value of Derivative Contracts
The following represents the fair value of the Company’s derivative contracts. Many of the Company’s
agreements allow for a netting arrangement. The following is presented on a gross basis, by type of contract:
2010 2009
(in millions) Balance Sheet Caption Fair Value Balance Sheet Caption Fair Value
Hedging Instruments:
Forward foreign exchange contracts . . Current assets $ 2 Current assets $ —
Total ....................... $ 2 $—
Non Hedging Instruments:
Forward foreign exchange contracts . . Current assets $— Current assets $ 1
European cross currency swap ...... Noncurrent liability — Non current liability (24)
Total ....................... $— $(23)
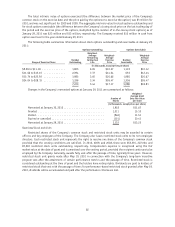
Notional Values and Foreign Currency Exchange Rates
The table below presents the notional amounts for all outstanding derivatives and the weighted-average
exchange rates of foreign exchange forward contracts at January 29, 2011:
Contract Value
(U.S. in millions) Weighted- Average
Exchange Rate
Inventory
Buy €/Sell British £ ............................... $66 .8439
Buy US/Sell €................................... 9 .7497
Intercompany
Buy €/Sell British £ ............................... $16 .8445
Buy US/Sell CAD$ ................................. 9 1.0034
Buy US/Sell €................................... 2 .7463
Buy €/Sell Swiss ƒ ................................ 2 1.2909
Diesel fuel forwards .............................. $ 2 —
Business Risk
The retailing business is highly competitive. Price, quality, selection of merchandise, reputation, store
location, advertising, and customer service are important competitive factors in the Company’s business. The
Company operates in 21 countries and purchased approximately 82 percent of its merchandise in 2010 from its
top 5 vendors. In 2010, the Company purchased approximately 63 percent of its athletic merchandise from one
major vendor, Nike, Inc., (‘‘Nike’’) and approximately 13 percent from another major vendor. Each of our operating
divisions is highly dependent on Nike; they individually purchase 46 to 81 percent of their merchandise from
Nike. The Company generally considers all vendor relations to be satisfactory.
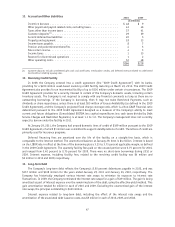
Included in the Company’s Consolidated Balance Sheet at January 29, 2011, are the net assets of the
Company’s European operations, which total $736 million and which are located in 17 countries, 11 of which have
adopted the euro as their functional currency.
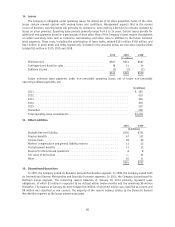
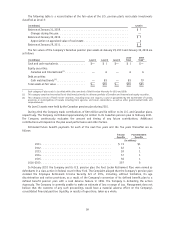
Fair Value of Financial Instruments
The carrying value and estimated fair value of long-term debt was $137 million and $139 million,
respectively, at January 29, 2011 and $138 million and $127 million, respectively, at January 30, 2010. The
carrying values of cash and cash equivalents and other current receivables and payables approximate their fair
value due to the short-term nature of these assets and liabilities.
53