Foot Locker 2010 Annual Report Download - page 38
Download and view the complete annual report
Please find page 38 of the 2010 Foot Locker annual report below. You can navigate through the pages in the report by either clicking on the pages listed below, or by using the keyword search tool below to find specific information within the annual report.-
 1
1 -
2
-
3
-
4
-
5
-
6
-
7
-
8
-
9
-
10
-
11
-
12
-
13
-
14
-
15
-
16
-
17
-
18
-
19
-
20
-
21
-
22
-
23
-
24
-
25
-
26
-
27
-
 28
28 -
 29
29 -
 30
30 -
 31
31 -
 32
32 -
 33
33 -
 34
34 -
 35
35 -
 36
36 -
 37
37 -
 38
38 -
 39
39 -
 40
40 -
 41
41 -
 42
42 -
 43
43 -
 44
44 -
 45
45 -
 46
46 -
 47
47 -
 48
48 -
49
-
50
-
51
-
52
-
53
-
54
-
55
-
56
-
57
-
58
-
59
-
60
-
61
-
62
-
63
-
64
-
65
-
66
-
67
-
68
-
69
-
70
-
71
-
72
-
73
-
74
-
75
-
76
-
77
-
78
-
79
-
80
-
81
-
82
-
83
-
84
-
85
-
86
-
87
-
88
-
89
-
90
-
91
-
92
-
93
-
94
-
95
-
96
-
97
-
98
-
99
-
100
-
101
-
102
-
103
-
104
 |
 |

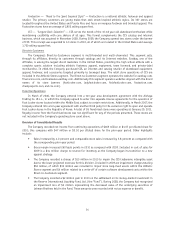
Depreciation and amortization of $112 million decreased by 13.8 percent in 2009 from $130 million in 2008.
This decrease primarily reflects the effect of the impairment charges offset, in part, by increased depreciation and
amortization related to the Company’s capital spending, as well as the amortization expense associated with the
CCS customer list intangible. The effect of foreign currency fluctuations was not significant.
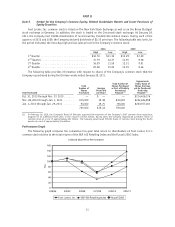
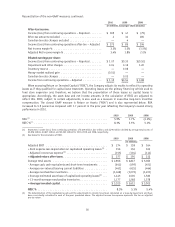
Interest Expense, Net
2010 2009 2008
(in millions)
Interest expense ...................................... $14 $13 $16
Interest income ...................................... (5) (3) (11)
Interest expense, net ................................. $ 9 $10 $ 5
Weighted-average interest rate (excluding fees):
Long-term debt ..................................... 7.6% 7.3% 6.2%
Interest expense of $14 million increased by $1 million as compared with 2009. The increase in interest
expense primarily relates to higher fees associated with the revolving credit facility. Interest expense in 2010
includes $1 million in amortization of the gain realized from the termination of the interest rate swap. The
Company did not have any short-term borrowings for any of the periods presented. Interest income of $5 million
increased from $3 million in 2009 primarily reflecting income earned on higher cash and cash equivalent
balances.
Interest expense of $13 million in 2009 decreased by $3 million as compared with 2008. The decrease in
interest expense primarily relates to the termination of the cross currency swaps, which represented expense of
$3 million in 2008, as well as lower average debt outstanding during 2009. Interest expense in 2009 was also
reduced by $1 million, reflecting the effect of the amortization of the gain realized from the termination of the
interest rate swap. This was offset, in part, by higher fees associated with the revolving credit facility. Interest
income of $3 million in 2009 declined from $11 million in 2008 primarily due to lower interest rates received on
its cash, cash equivalents and short-term investments.
Other Income
Other income was $4 million, $3 million, and $8 million for 2010, 2009, and 2008, respectively. For 2010,
other income includes a $2 million gain to reflect the settlement of the Reserve International Liquidity Fund
money-market investment, as well as royalty income from the Company’s franchising agreements and gains on
lease terminations related to certain lease interests in Europe. For 2009, other income includes $4 million related
to gains from insurance recoveries, gains on the purchase and retirement of bonds, and royalty income partially
offset by foreign currency option contract premiums of $1 million. Other income in 2008 primarily reflects a
$4 million net gain related to the Company’s foreign currency options contracts and a $3 million gain on lease
terminations related to two lease interests in Europe.
Income Taxes
The effective tax rate for 2010 was 34.3 percent, as compared with 36.0 percent in 2009. The effective tax
rate decreased primarily due to a benefit of $7 million from a favorable tax settlement. This benefit was offset in
part by a $4 million charge recorded in the fourth quarter to correct a historical error in the calculation of income
taxes on amounts included in accumulated other comprehensive loss pertaining to the Company’s Canadian
pension plans. The Company determined that this amount was not material to any previously issued financial
statements or to the current period; accordingly it was corrected in 2010. Additionally, the 2009 effective rate
included Canadian provincial tax rate changes that resulted in a $4 million expense arising from a reduction in
the value of the Company’s net deferred tax assets. Excluding these items, the effective rate increased as
compared with the prior year reflecting a higher proportion of income earned in higher tax jurisdictions.
The effective tax rate for 2009 was an expense of 36.0 percent, as compared with a benefit of 20.8 percent in
2008. The effective tax rate changed primarily due to impairment charges in 2008, which created an overall book
loss, coupled with the effect of an impairment of goodwill, a portion of which was not deductible for tax purposes,
as well as 2009 Canadian provincial tax rate changes that resulted in a $4 million charge for reduction in the
value of the Company’s net deferred tax assets.
19