Estee Lauder 2008 Annual Report Download - page 12
Download and view the complete annual report
Please find page 12 of the 2008 Estee Lauder annual report below. You can navigate through the pages in the report by either clicking on the pages listed below, or by using the keyword search tool below to find specific information within the annual report.-
 1
1 -
 2
2 -
 3
3 -
 4
4 -
 5
5 -
 6
6 -
 7
7 -
 8
8 -
 9
9 -
 10
10 -
 11
11 -
 12
12 -
 13
13 -
 14
14 -
 15
15 -
 16
16 -
 17
17 -
 18
18 -
 19
19 -
 20
20 -
 21
21 -
 22
22 -
23
-
24
-
25
-
26
-
27
-
28
-
29
-
30
-
31
-
32
-
33
-
34
-
35
-
36
-
37
-
38
-
39
-
40
-
41
-
42
-
43
-
44
-
45
-
46
-
47
-
48
-
49
-
50
-
51
-
52
-
53
-
54
-
55
-
56
-
57
-
58
-
59
-
60
-
61
-
62
-
63
-
64
-
65
-
66
-
67
-
68
-
69
-
70
-
71
-
72
-
73
-
74
-
75
-
76
-
77
-
78
-
79
-
80
-
81
-
82
-
83
-
84
-
85
-
86
-
87
-
88
-
89
-
90
-
91
-
92
-
93
-
94
-
95
-
96
-
97
-
98
-
99
-
100
-
101
-
102
-
103
-
104
-
105
-
106
-
107
-
108
-
109
-
110
-
111
-
112
-
113
-
114
-
115
-
116
-
117
-
118
-
119
-
120
 |
 |

10
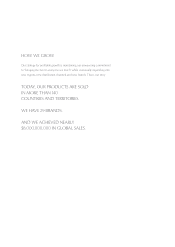
MULTI-NATIONAL
59% International
41% U.S.
46% International
54% U.S.
2003 2008
$5.0 Billion
$7.9 Billion
Fast-growing emerging
markets contributed
the sharpest gains.
MULTI-BRAND
20081968
Our brands are
among our most
important assets.
NUMBER OF BRANDS
NET SALES
2008
MULTI-CHANNEL
2003
We pursue channels
that create
retail excitement,
enhance our image
and drive our growth.
DISTRIBUTION MIX
44% North American
Department Stores
19% International
Department Stores
15% Perfumeries
6% Travel Retail
7% Retail Stores
4% Salons/Spas
5% Other (incl. distributors)
9% Retail Stores
5% Salons/Spas
7% Other (incl. distributors)
30% North American
Department Stores
26% International
Department Stores
15% Perfumeries
8% Travel Retail
0
5
10
15
2
0
2
5
3
0