Entergy 2008 Annual Report Download - page 95
Download and view the complete annual report
Please find page 95 of the 2008 Entergy annual report below. You can navigate through the pages in the report by either clicking on the pages listed below, or by using the keyword search tool below to find specific information within the annual report.-
 1
1 -
2
-
3
-
4
-
5
-
6
-
7
-
8
-
9
-
10
-
11
-
12
-
13
-
14
-
15
-
16
-
17
-
18
-
19
-
20
-
21
-
22
-
23
-
24
-
25
-
26
-
27
-
28
-
29
-
30
-
31
-
32
-
33
-
34
-
35
-
36
-
37
-
38
-
39
-
40
-
41
-
42
-
43
-
44
-
45
-
46
-
47
-
48
-
49
-
50
-
51
-
52
-
53
-
54
-
55
-
56
-
57
-
58
-
59
-
60
-
61
-
62
-
63
-
64
-
65
-
66
-
67
-
68
-
69
-
70
-
71
-
72
-
73
-
74
-
75
-
76
-
77
-
78
-
79
-
80
-
81
-
82
-
83
-
84
-
 85
85 -
 86
86 -
 87
87 -
 88
88 -
 89
89 -
 90
90 -
 91
91 -
 92
92 -
 93
93 -
 94
94 -
 95
95 -
 96
96 -
 97
97 -
 98
98 -
 99
99 -
 100
100 -
 101
101 -
 102
102 -
 103
103 -
 104
104 -
 105
105 -
106
-
107
-
108
 |
 |

9393
ENTERGY CORPORATION AND SUBSIDIARIES 2008
93
Notes to Consolidated Financial Statements continued
93
The trust asset investment strategy is to invest the assets in a
manner whereby long-term earnings (and cash contributions)
on the assets provide adequate funding for pension benefits
payments and certain postretirement benefit payments. Pursuant
to regulatory directives, Entergy Arkansas, Entergy Mississippi,
Entergy New Orleans, Entergy Texas, and System Energy
contribute postretirement benefit costs collected in rates into
trusts. System Energy is funding, on behalf of Entergy Operations,
postretirement benefits associated with Grand Gulf.
The mix of assets in the trusts is based on an optimization study
that identifies asset allocation targets in order to achieve the
maximum return for an acceptable level of risk, while minimizing
the expected contributions and pension and postretirement
expense. For certain regulatory jurisdictions, other postretirement
benefits are funded on a pay-as-you-go basis
In the optimization study, assumptions are formulated about
characteristics, such as expected asset class investment returns,
volatility (risk), and correlation coefficients among the various asset
classes. The future market assumptions used in the optimization
study are determined by examining historical market characteristics
of the various asset classes, and making adjustments to reflect future
conditions expected to prevail over the study period.
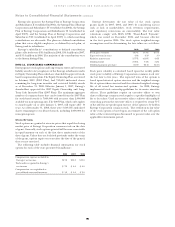
The optimization analysis utilized in the Plan Administrator’s
latest study produced the following approved asset class target
allocations.
Pension Postretirement
Domestic Equity Securities 45% 37%
International Equity Securities 20% 14%
Fixed-Income Securities 35% 49%
These allocation percentages combined with each asset class’
expected investment return produced an aggregate return
expectation for the five years following the study of 7.6% for
pension assets, 5.4% for taxable postretirement assets, and 7.2%
for non-taxable postretirement assets.
The expected long term rate of return of 8.50% for the qualified
retirement plans assets is based on the expected long-term return
of each asset class, weighted by the target allocation for each class
as defined in the table above. The source for each asset class’
expected long-term rate of return is the geometric mean of the
respective asset class total return. The time period reflected in the
total returns is a long dated period spanning several decades.
The expected long term rate of return of 8.50% for the non-
taxable Voluntary Employee Beneficiary Association (VEBA) trust
assets is based on the expected long-term return of each asset class,
weighted by the target allocation for each class as defined in the
table above. The source for each asset class’ expected long-term
rate of return is the geometric mean of the respective asset class
total return. The time period reflected in the total returns is a long
dated period spanning several decades.
For the taxable VEBA trust assets the allocation has a high
percentage of tax-exempt fixed income securities. The tax-exempt
fixed income long-term total return was estimated using total
return data from the 2008 Economic Report of the President. The
time period reflected in the tax-exempt fixed income total return
is 1929 to 2007. After reflecting the tax-exempt fixed income
percentage and unrelated business income tax, the long-term rate
of return for taxable VEBA trust assets is expected to be 6.0% in
2009 and beyond.
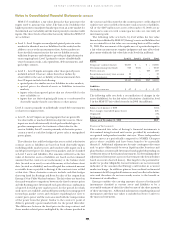
Since precise allocation targets are inefficient to manage security
investments, the following ranges were established to produce an
acceptable economically efficient plan to manage to targets:
Pension Postretirement
Domestic Equity Securities 45% to 55% 32% to 42%
International Equity Securities 15% to 25% 9% to 19%
Fixed-Income Securities 25% to 35% 44% to 54%
Other 0% to 10% 0% to 5%
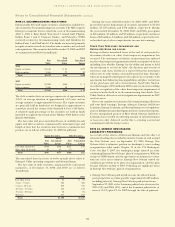
AC C U M U L A T E D PE N S I O N BE N E F I T OB L I G A T I O N
The accumulated benefit obligation for Entergy’s qualified pension
plans was $2.9 billion and $2.8 billion at December 31, 2008 and
2007, respectively.
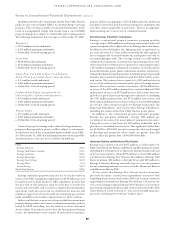
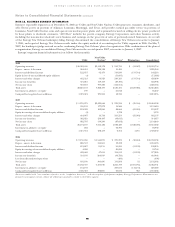
ES T I M A T E D FU T U R E BE N E F I T PA Y M E N T S
Based upon the assumptions used to measure Entergy’s qualified
pension and postretirement benefit obligation at December
31, 2008, and including pension and postretirement benefits
attributable to estimated future employee service, Entergy expects
that benefits to be paid and the Medicare Part D subsidies to be
received over the next ten years for Entergy Corporation and its
subsidiaries will be as follows (in thousands):
Estimated Future Benefits Payments
Postretirement Estimated Future
Qualified Non-Qualified (before Medicare Medicare Subsidy
Pension Pension Subsidy) Receipts
2009 $ 146,276 $16,695 $ 68,552 $ 5,175
2010 $ 151,060 $10,079 $ 73,153 $ 5,768
2011 $ 157,421 $ 9,695 $ 77,351 $ 6,433
2012 $ 167,107 $ 8,931 $ 81,247 $ 7,218
2013 $ 179,160 $15,419 $ 85,504 $ 8,054
2014–2018 $1,144,365 $77,569 $499,844 $53,895
CO N T R I B U T I O N S
Entergy Corporation and its subsidiaries expect to contribute $140
million (excluding about $1 million in employee contributions)
to the qualified pension plans and $76 million to its other
postretirement plans in 2009. Guidance pursuant to the Pension
Protection Act of 2006 rules, effective for the 2009 plan year and
beyond, may affect the level of Entergy’s pension contributions in
the future.