Entergy 2008 Annual Report Download - page 94
Download and view the complete annual report
Please find page 94 of the 2008 Entergy annual report below. You can navigate through the pages in the report by either clicking on the pages listed below, or by using the keyword search tool below to find specific information within the annual report.
9292
ENTERGY CORPORATION AND SUBSIDIARIES 2008
Notes to Consolidated Financial Statements continued
92
Entergy Arkansas, Entergy Mississippi, Entergy New Orleans,
and Entergy Texas have received regulatory approval to recover
SFAS 106 costs through rates. Entergy Arkansas began recovery
in 1998, pursuant to an APSC order. This order also allowed
Entergy Arkansas to amortize a regulatory asset (representing
the difference between SFAS 106 costs and cash expenditures
for other postretirement benefits incurred for a five-year period
that began January 1, 1993) over a 15-year period that began in
January 1998.
The LPSC ordered Entergy Gulf States Louisiana and Entergy
Louisiana to continue the use of the pay-as-you-go method for
ratemaking purposes for postretirement benefits other than
pensions. However, the LPSC retains the flexibility to examine
individual companies’ accounting for postretirement benefits to
determine if special exceptions to this order are warranted.
Pursuant to regulatory directives, Entergy Arkansas, Entergy
Mississippi, Entergy New Orleans, Entergy Texas, and System
Energy contribute the postretirement benefit costs collected in
rates to trusts. System Energy is funding, on behalf of Entergy
Operations, postretirement benefits associated with Grand Gulf.
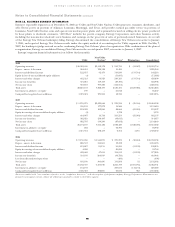
CO M P O N E N T S O F NE T OT H E R PO S T R E T I R E M E N T BE N E F I T CO S T
A N D OT H E R AM O U N T S RE C O G N I Z E D A S A RE G U L A T O R Y AS S E T
A N D/O R AOCI
Entergy Corporation’s and its subsidiaries’ total 2008, 2007, and
2006 other postretirement benefit costs, including amounts
capitalized and amounts recognized as a regulatory asset and/
or other comprehensive income, including amounts capitalized,
included the following components (in thousands):
2008 2007 2006
Other postretirement costs:
Service cost - benefits earned
during the period $ 47,198 $ 44,137 $ 41,480
Interest cost on APBO 71,295 63,231 57,263
Expected return on assets (28,109) (25,298) (19,024)
Amortization of transition obligation 3,827 3,831 2,169
Amortization of prior service cost (16,417) (15,836) (14,751)
Recognized net loss 15,565 18,972 22,789
Special termination benefits – 603 –
Net other postretirement benefit cost $ 93,359 $ 89,640 $ 89,926
Other changes in plan assets and benefit
obligations recognized as a regulatory
asset and/or AOCI (before tax)
Arising this period:
Prior service credit for period $ (5,422) $ (3,520)
Net (gain)/loss 59,291 (15,013)
Amounts reclassified from regulatory
asset and/or AOCI to net periodic
benefit cost in the current year:
Amortization of transition obligation (3,827) (3,831)
Amortization of prior service cost 16,417 15,836
Amortization of net loss (15,565) (18,972)
Total $ 50,894 $(25,500)
Total recognized as net periodic
benefit cost, regulatory asset,
and/or AOCI (before tax) $144,253 $ 64,140
Estimated amortization amounts from
regulatory asset and/or AOCI to net
periodic benefit cost in the following year
Transition obligation $ 3,729 $ 3,831 $ 3,831
Prior service cost $(17,519) $(16,417) $(15,837)
Net loss $ 19,018 $ 15,676 $ 18,974
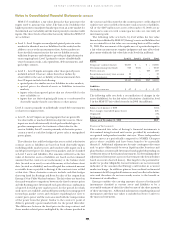
OT H E R PO S T R E T I R E M E N T BE N E F I T OB L I G A T I O N S ,
PL A N AS S E T S , FU N D E D ST A T U S , A N D AM O U N T S NO T YE T
RE C O G N I Z E D A N D RE C O G N I Z E D IN T H E BA L A N C E SH E E T
O F EN T E R G Y CO R P O R A T I O N A N D I T S SU B S I D I A R I E S A S O F
DE C E M B E R 31, 2008 A N D 2007
(IN T H O U S A N D S):
2008 2007
Change in APBO
Balance at beginning of year $1,129,631 $1,074,559
Service cost 47,198 44,137
Interest cost 71,295 63,231
Acquisition – 11,336
Plan amendments (5,422) (3,520)
Special termination benefits – 603
Plan participant contributions 8,618 11,384
Actuarial (gain)/loss (33,168) (19,997)
Benefits paid (68,799) (56,719)
Medicare Part D subsidy received 5,719 4,617
Balance at end of year $1,155,072 $1,129,631
Change in Plan Assets
Fair value of assets at beginning of year $ 350,719 $ 314,326
Actual return on plan assets (64,350) 20,314
Employer contributions 69,720 56,300
Plan participant contributions 8,618 11,384
Acquisition – 5,114
Benefits paid (68,799) (56,719)
Fair value of assets at end of year $ 295,908 $ 350,719
Funded status $ (859,164) $ (778,912)
Amounts recognized in the balance sheet
Current liabilities $ (29,594) $ (28,859)
Non-current liabilities (829,570) (750,053)
Total funded status $ (859,164) $ (778,912)
Amounts recognized as a regulatory asset
(before tax)
Transition obligation $ 12,436 $ 12,435
Prior service cost (966) (30,833)
Net loss 266,086 224,532
$ 277,556 $ 206,134
Amounts recognized as AOCI (before tax)
Transition obligation $ 2,483 $ 6,709
Prior service cost (35,108) (16,634)
Net loss 114,864 112,692
$ 82,239 $ 102,767
Qualified Pension and Other Postretirement Plans’ Assets
Entergy’s qualified pension and postretirement plans’ weighted-
average asset allocations by asset category at December 31, 2008
and 2007 are as follows:
Qualified Pension Postretirement
2008 2007 2008 2007
Domestic Equity Securities 43% 44% 37% 37%
International Equity Securities 19% 20% 13% 14%
Fixed-Income Securities 36% 34% 50% 49%
Other 2% 2% –% –%


